Computer Vision
Malaria detection with deep learning: a CNN that misses just 3 of 1,300 infections
27,558 blood-cell images, eleven model variants, one clinical priority: never miss an infection. The winning model reaches 99.77% sensitivity and fits on a phone at around 724 KB. An MIT capstone, honestly measured, with a reproducible companion repository.
Malaria is still diagnosed the way it was a century ago: an expert examines a Giemsa-stained blood smear under a microscope, searching cell by cell for the parasite. Accurate, but slow and scarce, exactly where the disease is most common. The question behind this project: can a deep-learning model reliably classify a single red blood cell as infected or healthy, accurately enough for clinical use, and small enough to run offline on a smartphone?
The dataset
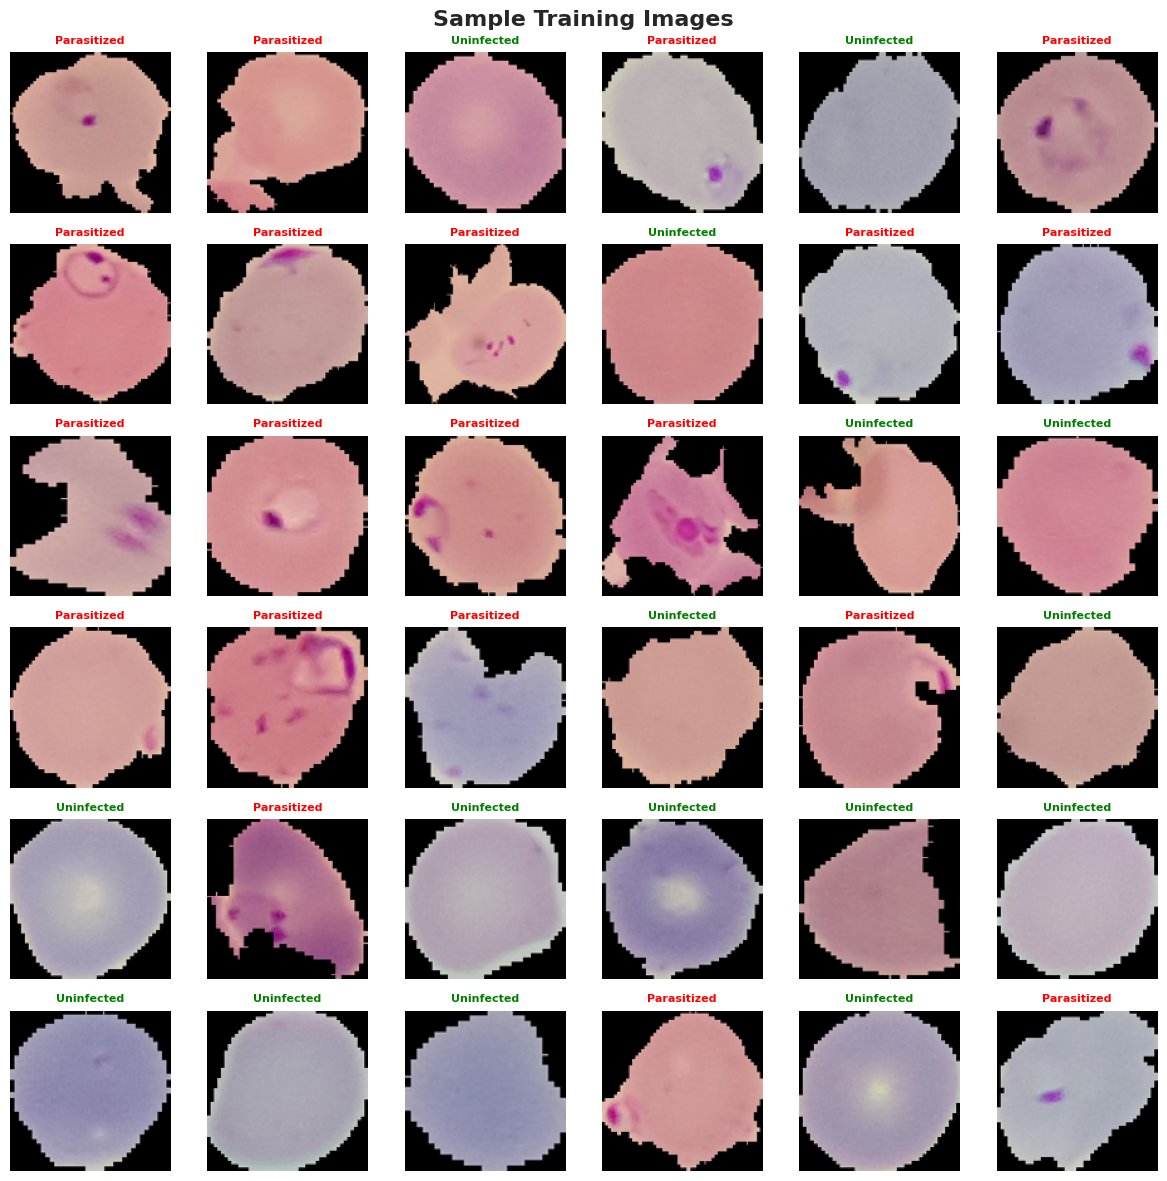
The basis is 27,558 microscopy images of individual red blood cells from the public NIH Malaria Cell Image Dataset (Lister Hill National Center for Biomedical Communications, U.S. National Library of Medicine; annotated by experts at the Mahidol-Oxford Tropical Medicine Research Unit, Bangkok). The classes are nearly balanced (50.4% parasitized / 49.6% healthy). Training used 24,958 images (80/20 validation split), evaluated on a strictly held-out test set of 2,600 images, exactly 1,300 per class. Images vary in size (median ~130×130 px) and were resized to 128×128 (custom CNNs) or 224×224 (VGG16).
The approach: eleven variants, one clinical priority
Rather than a single model, eleven architecture variants were built and compared, each judged not only on accuracy but on the metrics that matter clinically: sensitivity (how many true infections are caught) and the absolute number of missed infections. A missed malaria case is far costlier than a false alarm.
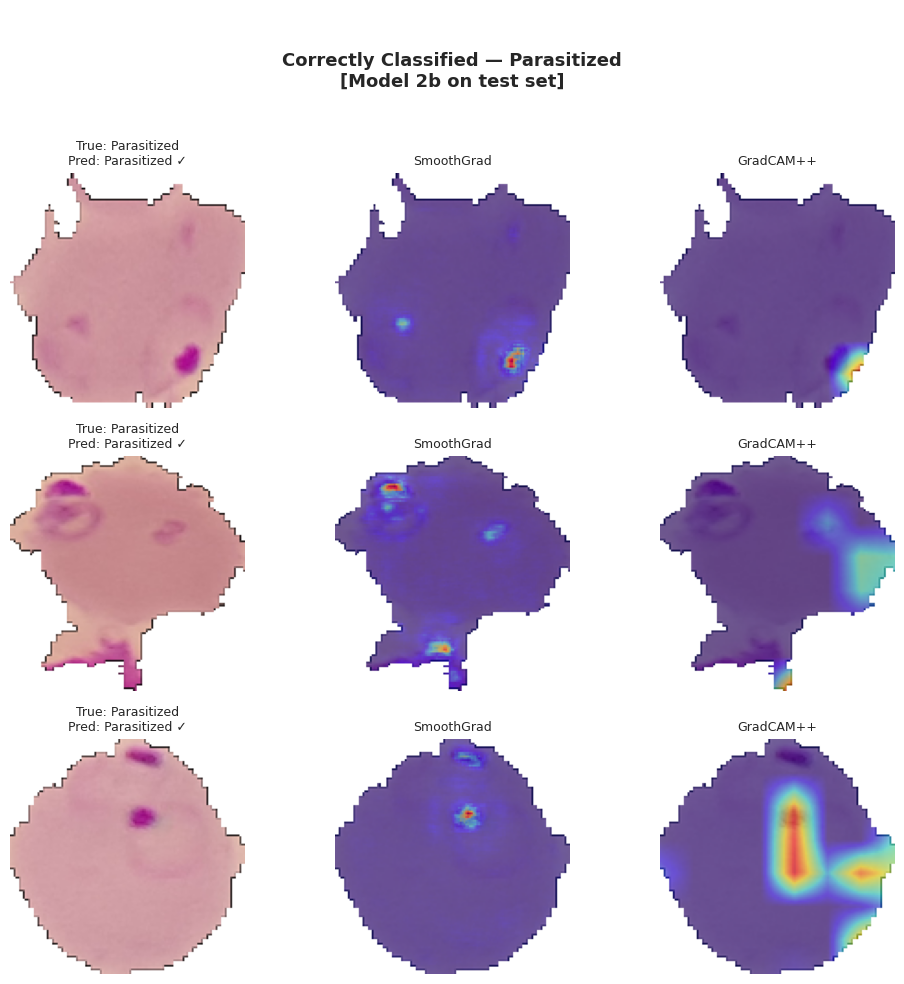
The field ranged from lean 3-block CNNs (Flatten vs. Global Average Pooling), through deeper networks with BatchNorm and LeakyReLU, a 5-block network (“Model 2b”), data augmentation, VGG16 transfer learning (frozen and two-phase fine-tuned), to a colour-space study (saturation-only, hue + saturation, full HSV). Model decisions were made visible with GradCAM++.
Results
On the held-out test set (2,600 images, 1,300 per class):
| Model | Accuracy | Sensitivity | Specificity | AUC | Missed infections | Params |
|---|---|---|---|---|---|---|
| Model 2b: 5-block CNN (selected) | 98.85% | 99.77% | 97.92% | 0.9995 | 3 / 1,300 | 724 K |
| HS-Only (hue + saturation) | 98.88% | 99.08% | 98.69% | 0.9991 | 12 / 1,300 | 724 K |
| Base CNN (Global Average Pooling) | 98.65% | 99.46% | 97.85% | 0.9991 | 7 / 1,300 | 55 K |
| VGG16 (fine-tuned) | 97.62% | 98.77% | 96.46% | 0.9977 | 16 / 1,300 | 14.7 M |
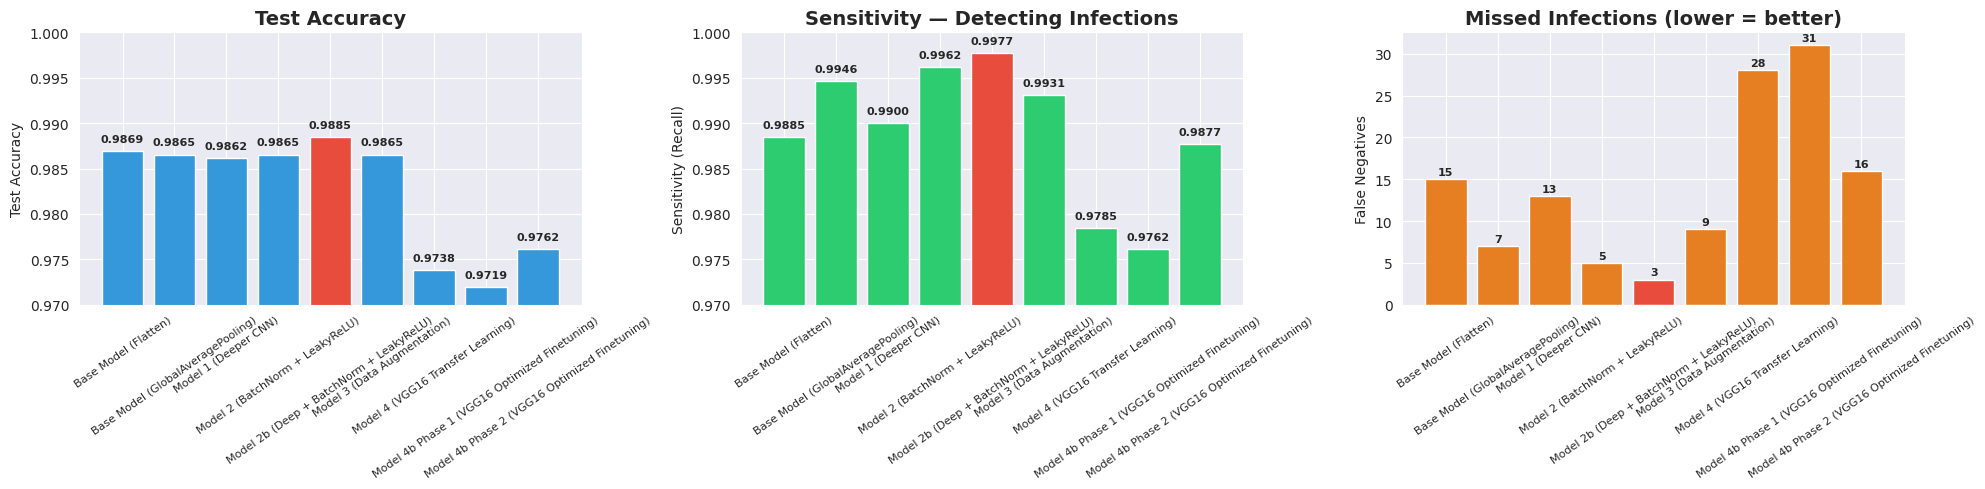
HS-Only edged ahead on raw accuracy (98.88%). Model 2b was chosen anyway for the metric that matters clinically: 99.77% sensitivity, only 3 missed infections in 1,300 (AUC 0.9995, F1 0.9886). Quantized to INT8 it weighs about 724 KB, small enough for on-device inference.
What the analysis actually shows
- Compact custom CNNs beat VGG16 transfer learning. 14.7 M parameters on ~20,000 training images overfit; the microscopy→ImageNet domain gap and upscaling from 130 to 224 px cost more than the big model returned (98.85% vs. 97.62%).
- The diagnostic signal is in colour, not luminance. Hue + saturation alone reached the best accuracy; adding the value channel hurt, which is evidence that Giemsa staining encodes the contrast chromatically.
- Global Average Pooling beats Flatten: −81% parameters and higher sensitivity.
- Some “errors” are label noise. GradCAM++ on false positives showed focal activation indistinguishable from true positives: measured accuracy is limited by annotation quality, not architecture.
From model to deployment, and what it is not (yet)
At around 724 KB, the model is meant for offline inference on a smartphone, as a screening aid, not a diagnostic device. It was trained on a single public dataset (P. falciparum) and needs multi-site external validation plus expert review of error cases before any real-world use. Those limits are part of the result, and that is the difference between a benchmark and a defensible claim.
Reproducibility & verification
The full, executed code (EDA, all eleven models, interpretability) is in the companion repository: github.com/myBytesResearch/mit-capstone-gwinger. The project was completed as a capstone in the MIT Professional Education Applied AI and Data Science Program (verifiable certificate).