Research Methodology
Two analysts, one dataset: where the numbers agree and the recommendations diverge
We analysed the same delivery dataset independently - 1,898 orders, the same questions. The numbers match to the decimal. The recommendations do not. That difference is exactly where data-driven decisions actually get made.
There is a comfortable assumption about data analysis: if the data is right, the decision follows by itself. We were able to test that assumption on ourselves. As part of our MIT program we both worked through the same delivery-platform dataset, answering the same prescribed questions, without comparing notes along the way. The result up front: the numbers are identical. What we conclude from them is not.
The dataset
The basis is 1,898 orders from a delivery platform with nine attributes: restaurant, cuisine type, order value, day of week, rating, preparation time and delivery time. Behind them are 1,200 customers and 178 restaurants across 14 cuisine types. No values are missing. The dataset is a public educational dataset used in the MIT program.
What both analyses agree on
This agreement is explicitly not an achievement but the expectation: same dataset, same questions, correct craft. The opposite would have been remarkable. The shared factual base:
| Metric | Value |
|---|---|
| Orders / customers / restaurants | 1,898 / 1,200 / 178 |
| Order value (mean / median) | $16.50 / $14.14 |
| Orders above $20 | 555 (29.24%) |
| Preparation time (mean) | 27.37 min |
| Delivery time (mean) | 24.16 min |
| Total time above 60 min | 200 orders (10.54%) |
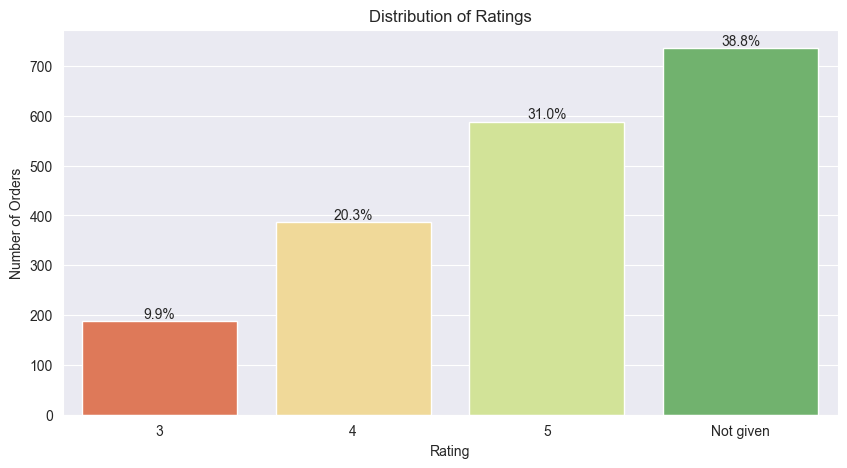
| Unrated orders | 736 (38.78%) |
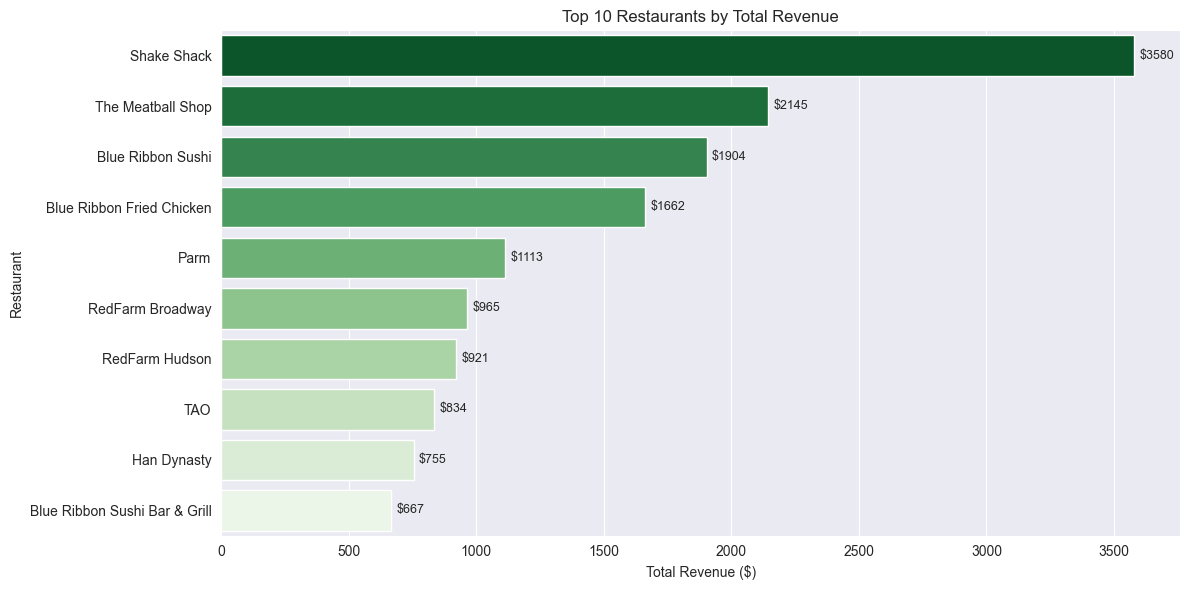
| Net commission revenue | $6,166.30 |
All figures in US dollars, as per the source dataset.
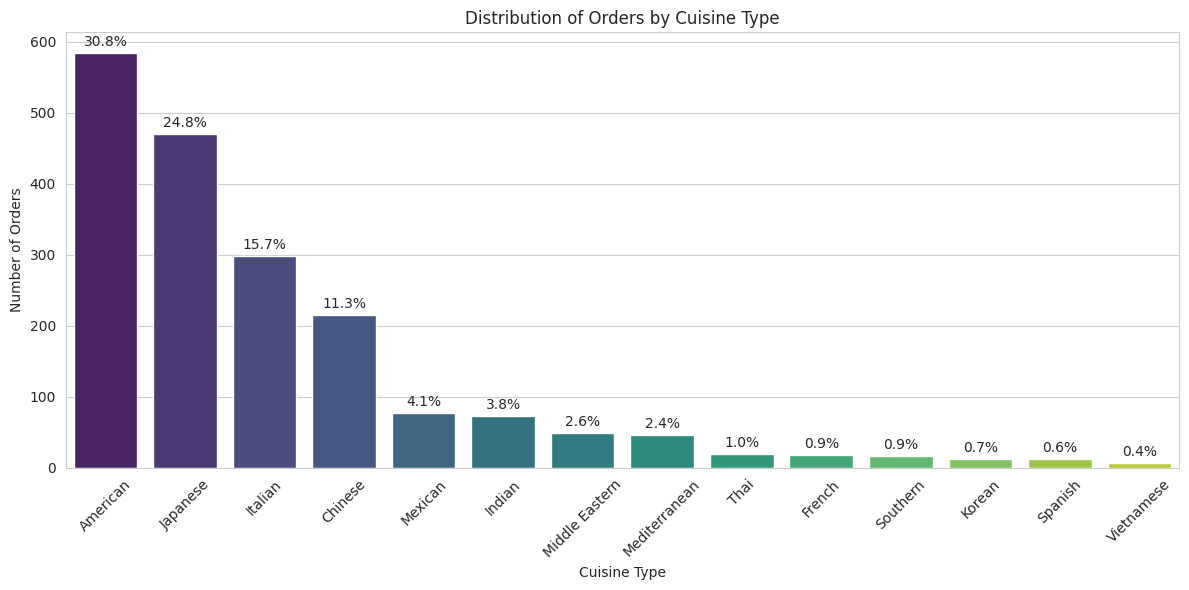
Two findings stand out. First, almost four in ten orders are unrated - which puts every statement about satisfaction on a sample that selected itself. Second, demand is clearly concentrated: American and Japanese together account for more than half of all orders.
The finding where the paths split
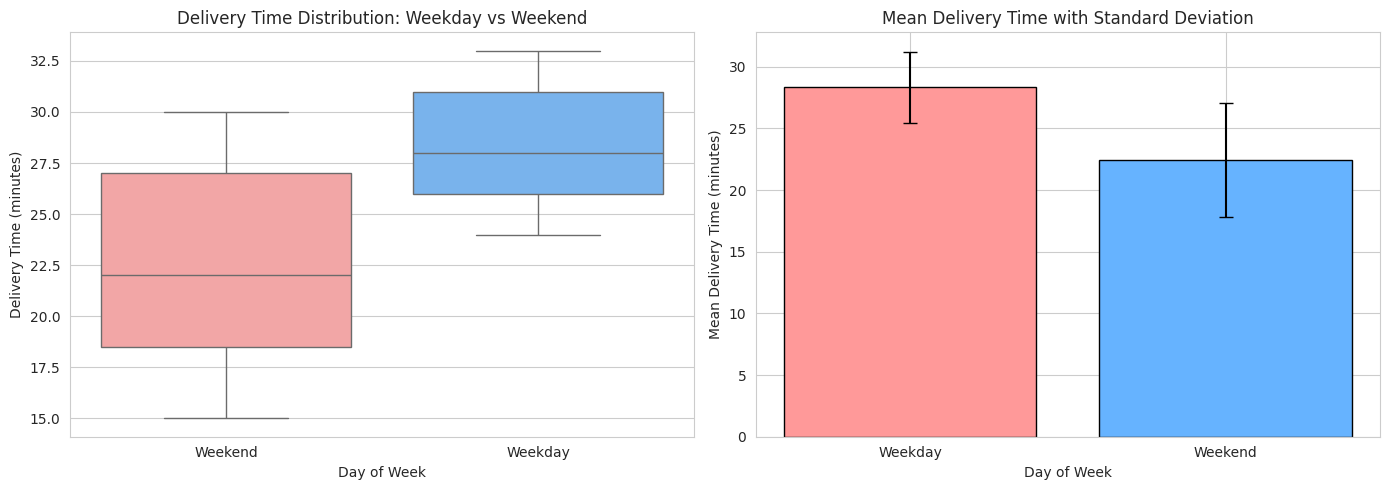
The platform delivers faster on weekends than on weekdays: 22.47 minutes against 28.34 minutes - almost six minutes apart. At the same time weekend order volume is markedly higher. Both analyses reach this result. Both draw something different from it.
| Same finding | Reading A | Reading B |
|---|---|---|
| Fewer weekday orders, slower delivery | The weekday is untapped demand: promotions and corporate lunch business. | The weekday is an operations problem: first find out why delivery is slower. |
| Weekend carries the volume | Already strong, so look for growth where it is missing. | Expand weekend capacity where demand is demonstrably there. |
| High-value cuisines vs. affordable ones | Premium positioning for the expensive cuisines. | Expand affordable cuisines to broaden the offering. |
| 38.78% unrated | Set a concrete target: below 20%. | Cause first: make rating easier in the first place. |
Neither reading is wrong, and neither follows necessarily from the data. They differ in the assumption about where the bottleneck sits - in demand or in operations. That assumption is not in the dataset.
What this means for data projects
- Reproducibility is the entry ticket, not the result. Two analyses producing the same numbers proves clean craft - nothing more. Selling reproducibility as a result confuses a precondition with an insight.
- The recommendation is the actual modelling step. Between metric and measure sits an assumption about causes. It belongs on the table, not dressed up as "data-driven".
- Missing data is a finding. 38.78% unrated orders are not a gap in the report but the most important statement about the platform's data quality.
- Which is why two analyses. When two independent readings translate the same number into opposing measures, that is the moment a decision gets made deliberately - instead of emerging unnoticed from a chart.
Reproducibility & verification
Both fully executed analyses are open: github.com/myBytesResearch/foodhub-order-analysis-gwinger and github.com/myBytesResearch/foodhub-order-analysis-mpianowski. Both were completed as coursework in the Applied AI and Data Science Program at MIT Professional Education (verifiable certificates: Guido Winger, Mariusz Pianowski).