Customer Analytics
Customer segmentation with clustering: three actionable segments from 2,240 customers
Five clustering algorithms compared, one decision made with judgement: the model with the best score doesn't win, but the one you can actually operate does. The result is three operationally usable customer segments and a campaign strategy that follows the budget. An MIT capstone with a reproducible companion repository.
A retailer runs campaigns across web, catalogue and store for six product categories and gets acceptance rates of just 1 to 15%. The reason is simple: every customer is treated the same. The question behind this project: can unsupervised learning read the natural customer segments out of the behavioural data, so the marketing budget flows where it actually converts? There is no target label, so the structure has to be found.
The dataset
The basis is a public marketing dataset (marketing_campaign.csv) with 2,240
customer records and 26 attributes: demographics, category spend (wine, fruit, meat, fish,
sweets, gold), channel behaviour (web/catalog/store/deals) and responses to five campaigns. After
cleaning (median imputation for income, one extreme outlier removed), 2,232 customers
remain modelled. 17 behavioural features go into the clustering, and demographics are kept
for profiling only. The dataset is a public educational dataset provided within the MIT capstone
program; dataset rights remain with the original publisher.
The approach: five algorithms, one usable structure
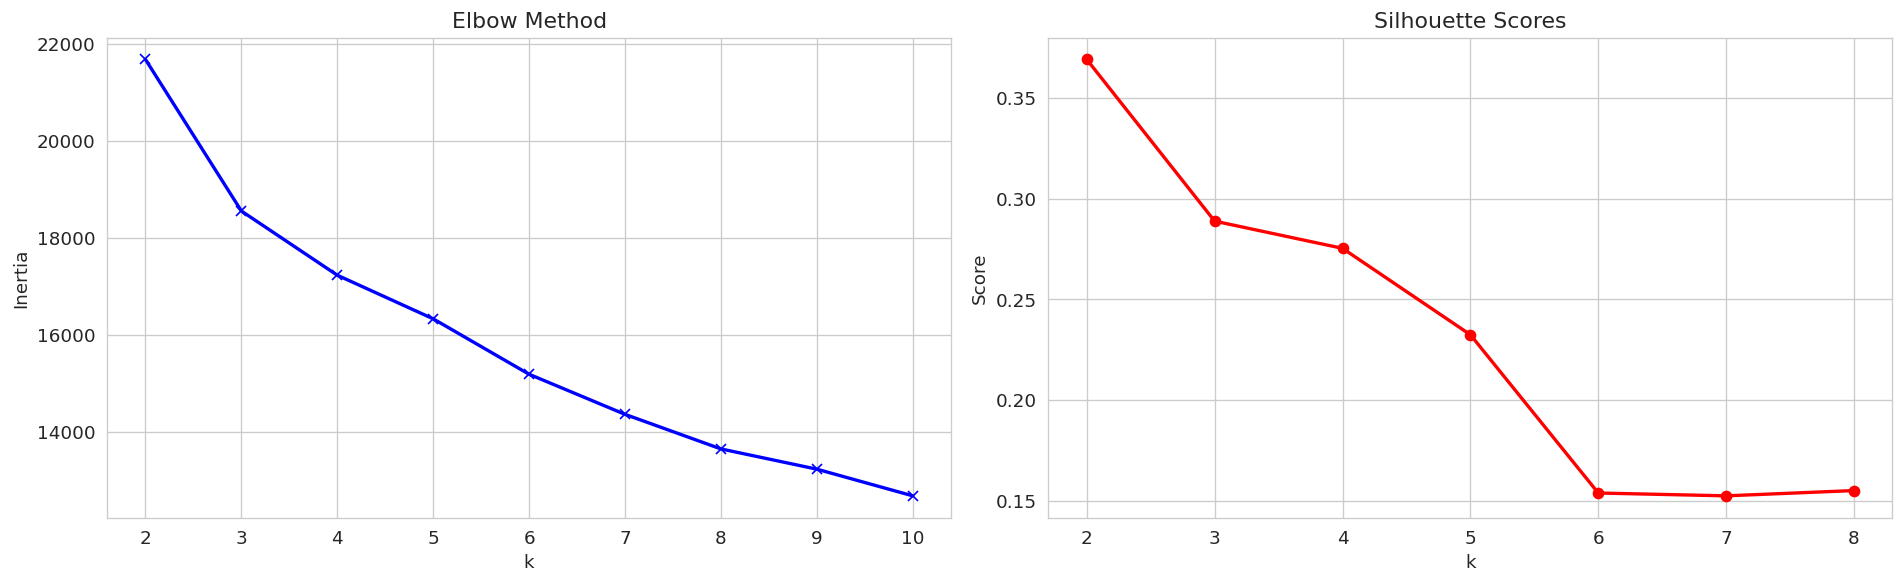
Exploratory analysis surfaced three patterns: income is the strongest spend driver, wine + meat make up ~75% of spend, and children sharply reduce premium spend. After feature engineering (8 new features), StandardScaler and PCA (10 components, 90.7% variance), five clustering algorithms were compared, judged on silhouette score and operational usability: K-Means, K-Medoids, Hierarchical (Ward), DBSCAN and Gaussian Mixture.
Results
Silhouette score at k=3 per algorithm:
| Algorithm (k=3) | Silhouette | Verdict |
|---|---|---|
| K-Means (selected) | 0.2888 | Balanced, interpretable, assigns new customers |
| K-Medoids | 0.2670 | Comparable, slower |
| Hierarchical (Ward) | 0.2661 | Confirms the same 3-segment structure |
| Gaussian Mixture | 0.1808 | Weaker separation |
| DBSCAN | 0.4820 | Rejected: 2,216 in one cluster + 10 noise points, can't assign new customers |
DBSCAN scored highest, but is useless in production (one dominant cluster, no way to place new customers). The K-Means silhouette of 0.2888 marks a moderate but still operationally interpretable structure, not a case of cleanly isolated clusters. K-Means (k=3) was chosen because its three segments are reproduced by K-Medoids and Hierarchical clustering. The confidence comes from that reproduction, not from the size of the score. The best score doesn't win, but the defensible, deployable solution does.
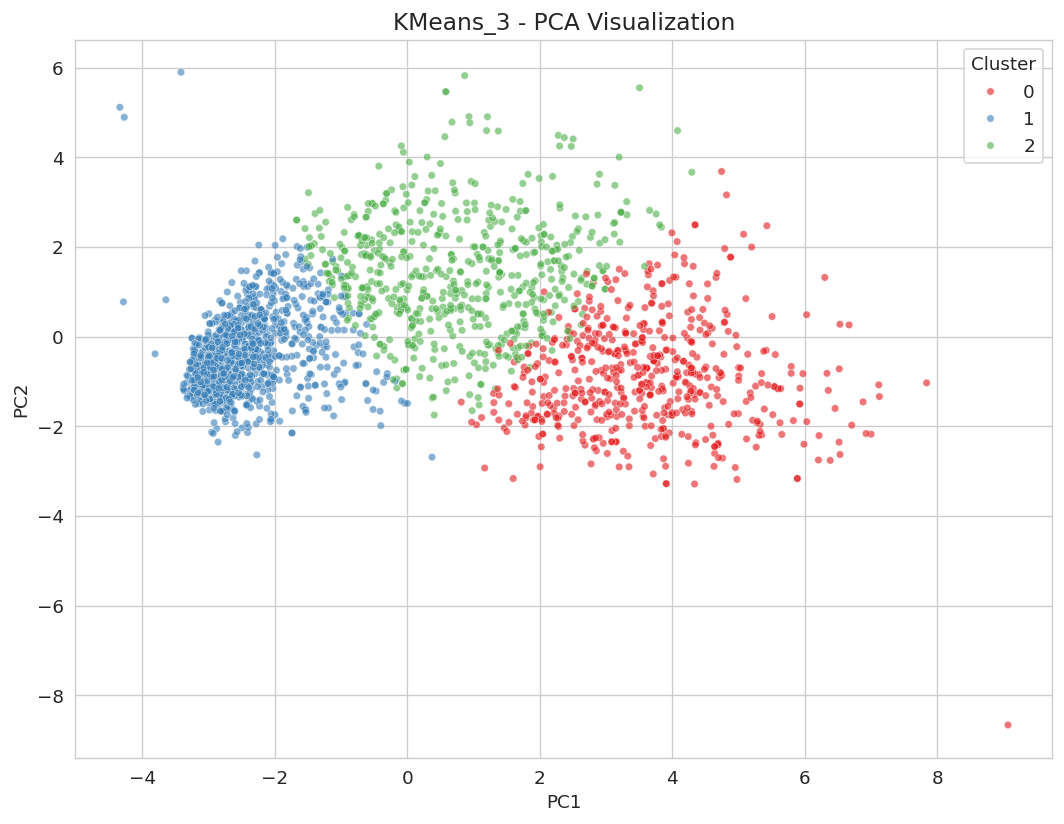
The three segments
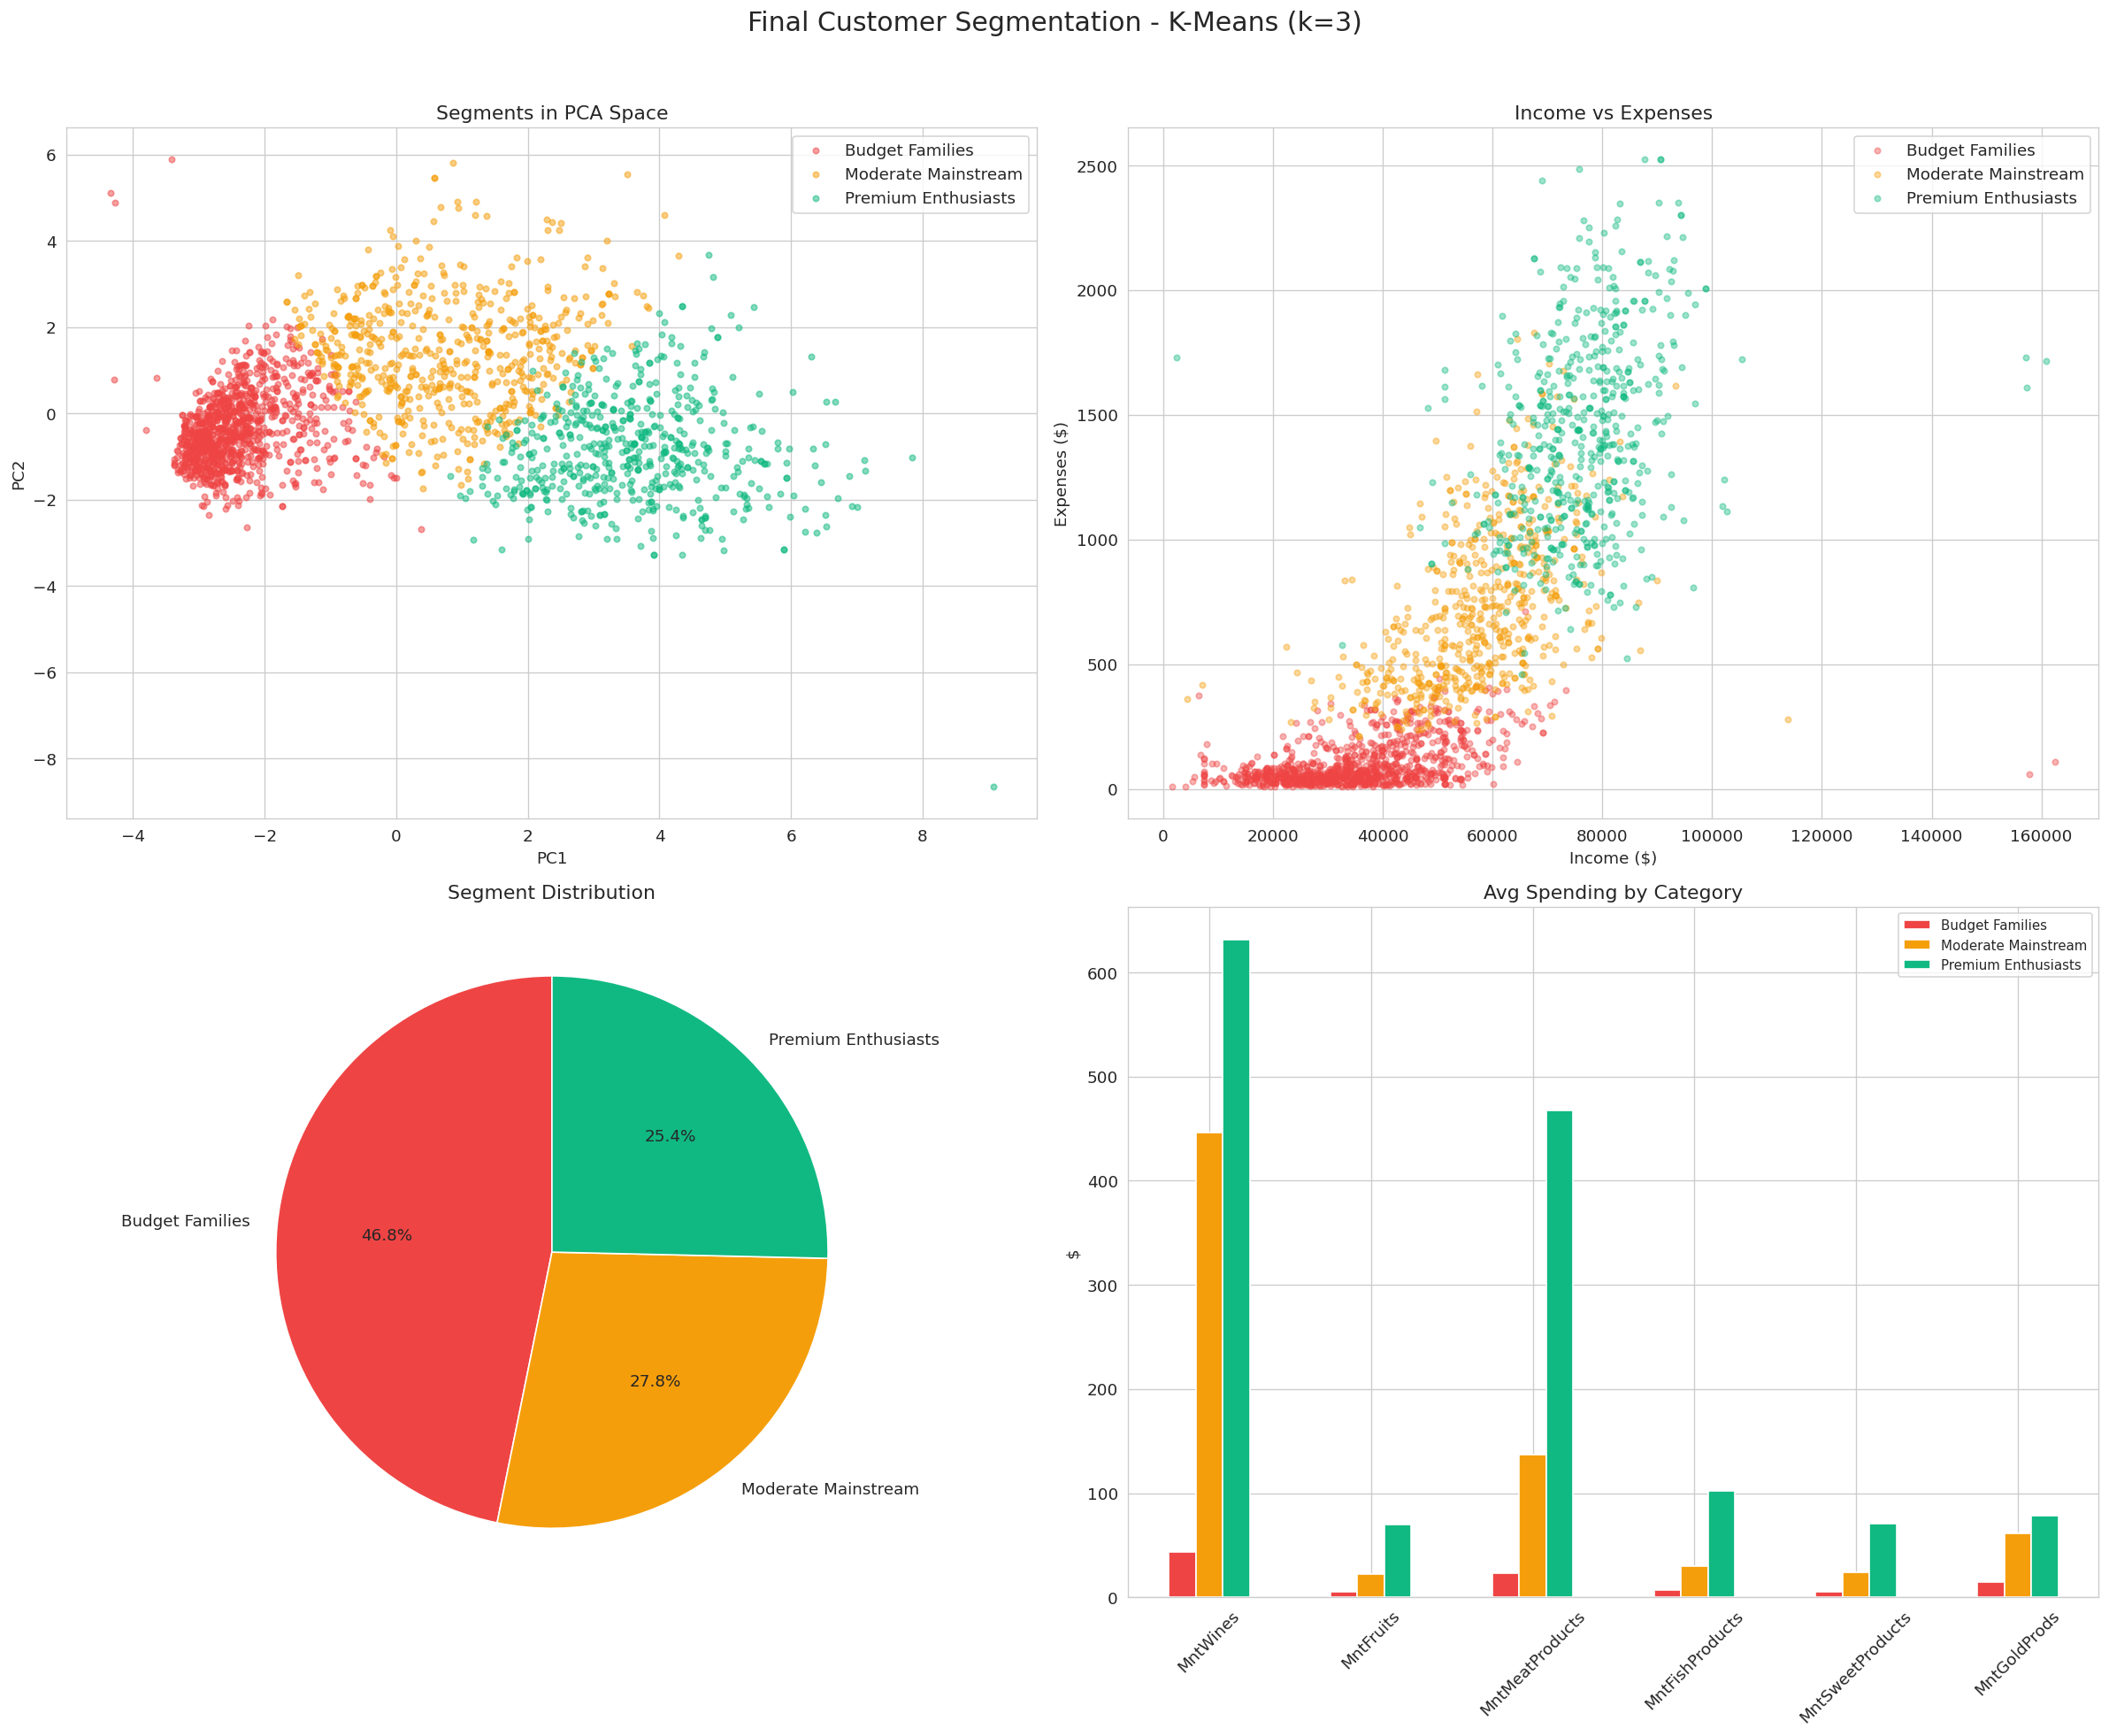
| Segment | Share | Avg income | Avg spend | Campaigns accepted |
|---|---|---|---|---|
| Premium Enthusiasts | 25.4% | $76,319 | $1,420 | 1.01 |
| Moderate Mainstream | 27.8% | $57,292 | $721 | 0.40 |
| Budget Families | 46.8% | $35,475 | $99 | 0.17 |
All figures in US dollars, as per the source dataset.
From clusters to strategy
- Three-tier campaigns. Premium: exclusive/VIP, catalogue + in-store. Mainstream: cross-sell/loyalty, omnichannel. Budget: deals & family bundles, mobile + email.
- Budget where it converts. The Premium share rises, the Budget share falls.
- Channel fit. Stop catalogue mailings to Budget; scale catalogue for Premium.
The projected financial upside (~$98K net benefit / ~196% first-year ROI) is a model calculation on stated assumptions, not a measured result.
Reproducibility & verification
The full, executed code (EDA, feature engineering, five-algorithm comparison, segment profiling) is in the companion repository: github.com/myBytesResearch/mit-capstone-mpianowski. The project was completed as a capstone in the MIT Professional Education Applied AI and Data Science Program (verifiable certificate).