EUDR Supply-Chain Intelligence
EUDR without gut feeling
How an auditable risk mask per pixel works
On 18 December 2025 the EU Council formally adopted the second postponement of the Deforestation Regulation (Council press release). Six months before the new deadline for large operators and twelve months before the SME deadline, the EUDR has thereby become truly binding. In the provider conversations we have been involved in since early 2026, a dividing line shows: providers who can set out their own methodology in writing, and providers who essentially produce maps.
This article answers the question every procurement, compliance and risk function currently has to ask: which EUDR risk definition is auditable at all? We describe the simplest viable answer, a two-mask AND operation that traces every risk pixel back to two public data layers. The procedure is evidenced on two real West African example regions, on a concrete audit-trail format and on a companion repository in which the whole operation can be recomputed by an external person.
1 · What the EUDR actually requires, and what providers often make of it
Regulation (EU) 2023/1115 sets three central obligations binding every operator who places one of the seven relevant commodities (cocoa, coffee, palm oil, soy, rubber, timber, cattle) on the EU market:
- Article 2 defines the cut-off date: after 31 December 2020 no deforestation may have taken place on the growing area.
- Article 9 requires the geolocation of each plot.
- Article 10 requires a documented risk assessment per plot establishing a negligible risk of non-compliance.
In practice this obligation meets a provider market that currently offers mainly two simplifications. The
first is “mask A only”. Providers render Hansen forest-loss maps and report pixels with
lossyear ≥ 2021 as risk. This produces systematic false positives, because a lost natural-forest
pixel is not an EUDR risk as long as it is not used today for the in-scope commodity. The
second is “certificate only”. RSPO, Rainforest Alliance or Fairtrade audits are accepted as
proof of compliance. These are valuable social and sustainability standards, but they are not geo-evidence in
the sense of Articles 9 and 10.
The EUDR requires both: a statement about the history of the area and a statement about its present use. Only the link of the two statements is a risk definition that an auditor can look at, check and accept.
1.5 · When the first placer falls, the buyers fall with it
The second postponement revision of December 2025 introduced an additional simplification: only the first operator placing the relevant product on the EU market bears the due-diligence-statement obligation (European Parliament, 17 December 2025). Downstream operators and traders are administratively relieved.
This simplification does not protect downstream buyers in any of the seven EUDR commodity chains from the commercial consequences; it merely shifts the risk into other channels:
- A sanction against the first placer under Article 24 closes the placing of the affected goods. The buyer then faces a stockout, even if it did nothing wrong formally.
- Press and NGO reporting typically names not the anonymous importer but the well-known consumer brand. The Mighty Earth cocoa-belt reporting series since 2017 shows the pattern in the cocoa sector quite clearly. Analogous series exist for palm oil, soy, cattle and timber: each referenced headline links deforestation findings directly to the known consumer brand, not to the intermediate importers.
- Supply and purchase contracts with the first placer must clarify who legally bears the sanction risk. In the standard contracts known to us this is rarely settled unambiguously.
- A compliance scarcity premium is plausible but still a hypothesis. By analogy with the sustainability-premium effects that Bunn et al. 2015 document in Climatic Change for climate-certified coffee, compliant cocoa is to be expected to become a scarcer good after the first sanction cases, with the premium reaching the buyer. This is not yet empirically dependable, because the deadline window is still open (see the limitations section).
- In parallel, the Corporate Sustainability Due Diligence Directive continues, in its 2026 Omnibus version. The original Directive (EU) 2024/1760 was simplified and postponed on 26 February 2026 by the Omnibus Directive (EU) 2026/470: transposition by 26 July 2028, application from 26 July 2029, thresholds raised to over 5,000 employees and over EUR 1.5 billion turnover. For companies within this threshold the due-diligence obligation to identify risk in the value chain remains, independent of the EUDR first-placer allocation. Anyone within the EUDR scope and the CSDDD scope is in fact still under obligation.
- Trade-credit insurers such as Atradius and Allianz Trade as well as supply-chain finance providers have increasingly established ESG and compliance clauses in credit terms over recent years. EUDR compliance will prospectively become part of these clauses. The exact diffusion across market participants is market practice, but publicly systematic evidence on it is not available.
The methodological consequence is clear. The simplification concentrates the risk on a single node, the first placer. This makes the buyer paradoxically more dependent on that one node working in a methodologically clean way. Anyone who cannot verify it verifies their own stockout shock after the fact.
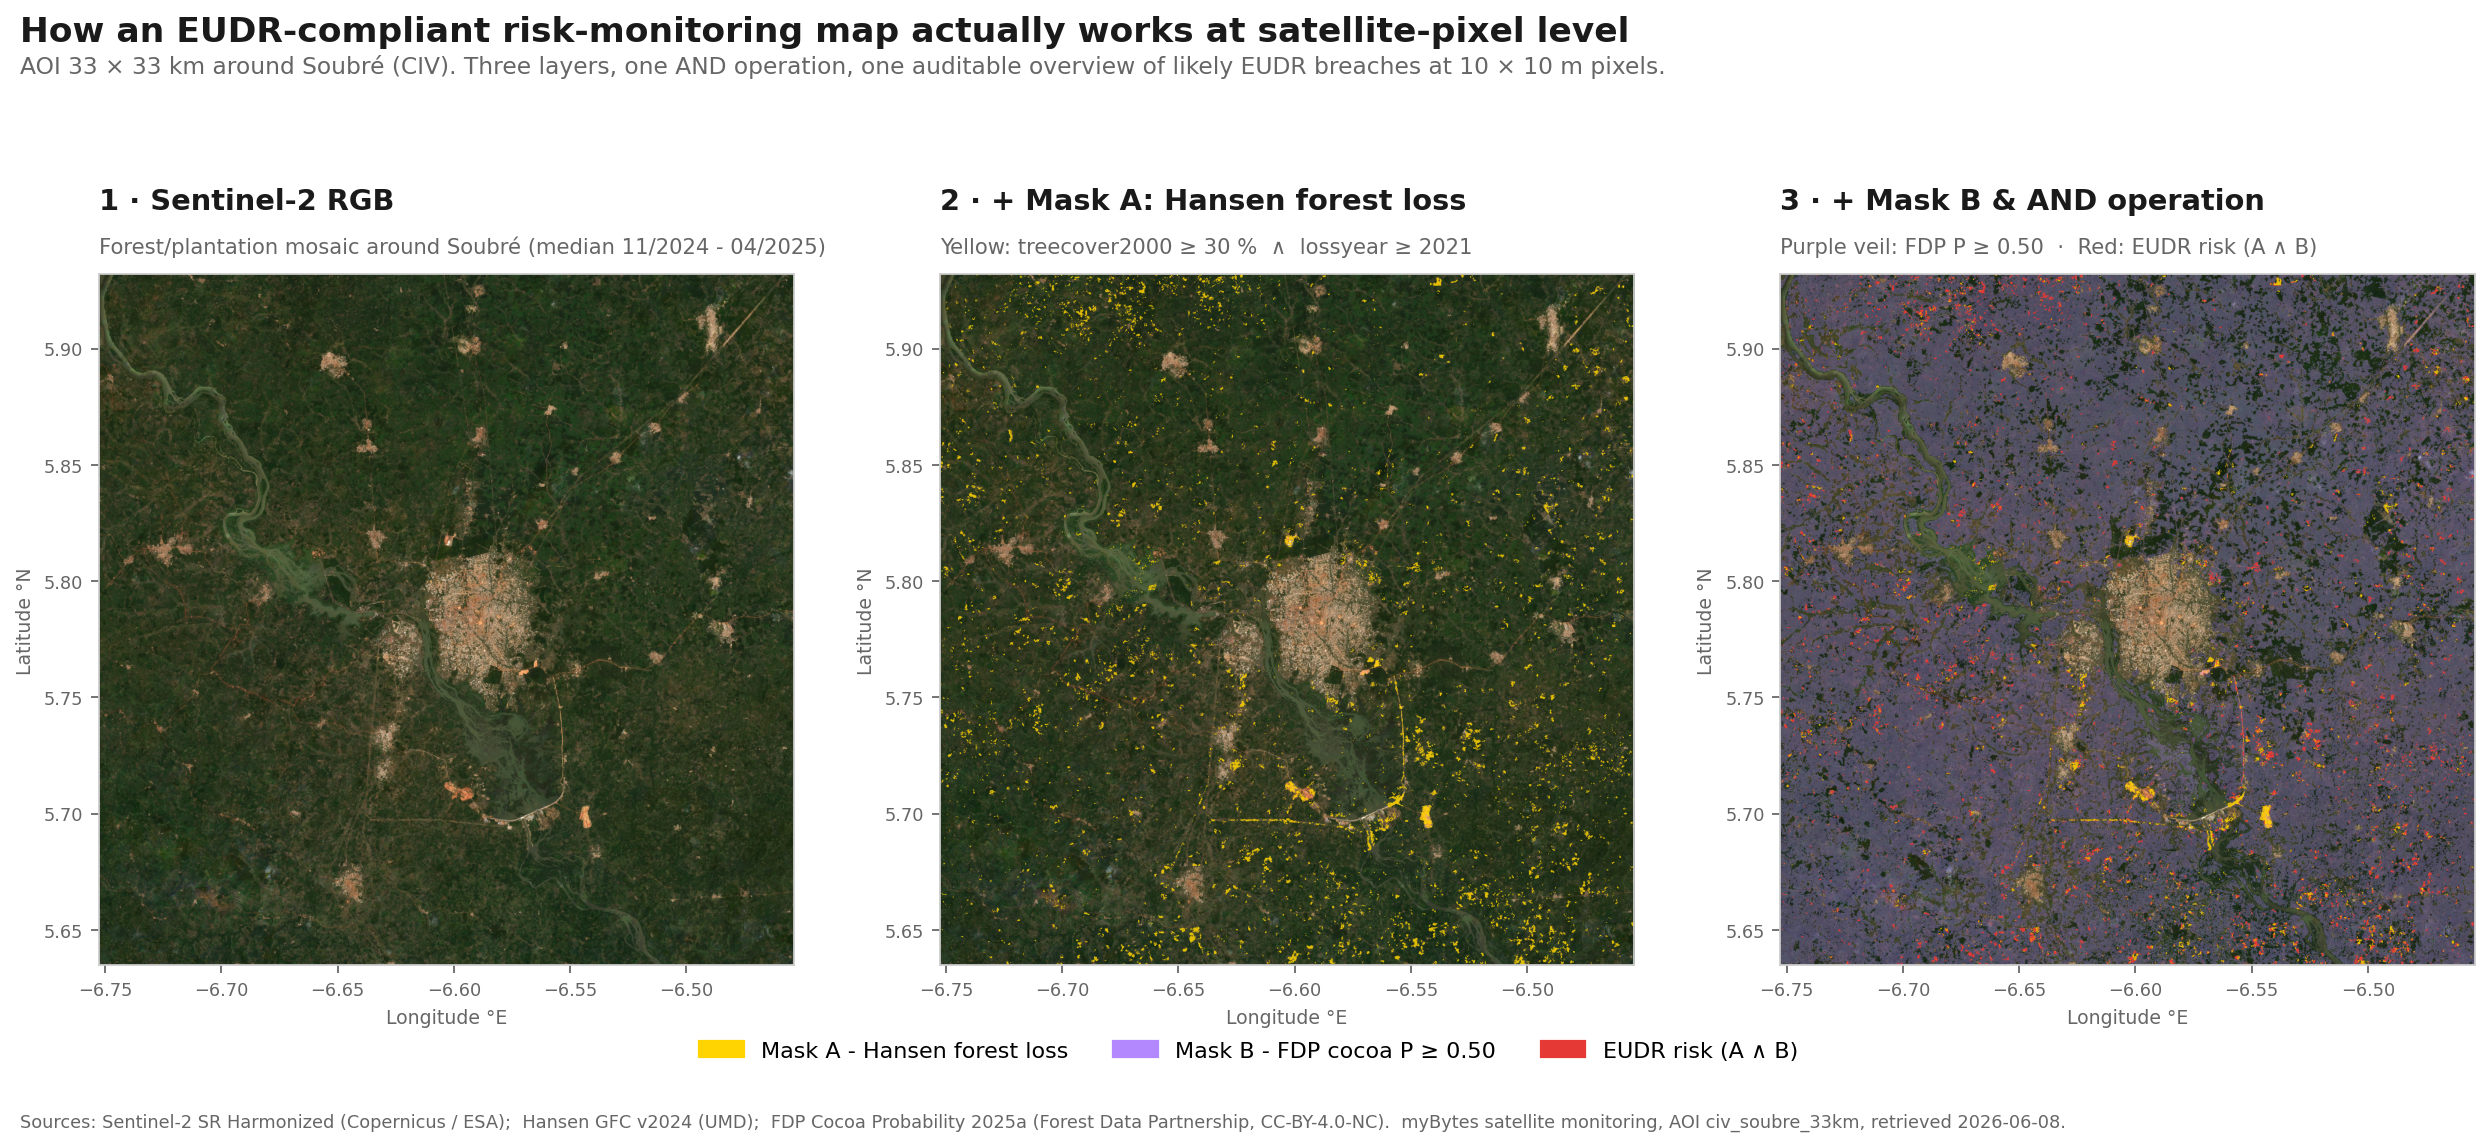
2 · The two-mask operation
The simplest possible EUDR risk definition consists of two boolean masks and one logical AND link.
2.1 · Mask A, historical forest loss after cut-off
The Hansen Global Forest Change product (Hansen et al. 2013, Science) publishes an annually updated raster with the year of forest loss per 30-metre pixel plus a forest baseline layer giving, per pixel, the tree cover in the year 2000 in per cent. Both bands are needed for the EUDR-relevant statement. Mask A selects pixels whose tree cover in the year 2000 was at least 30 % and which have been recorded as forest loss since 2021.
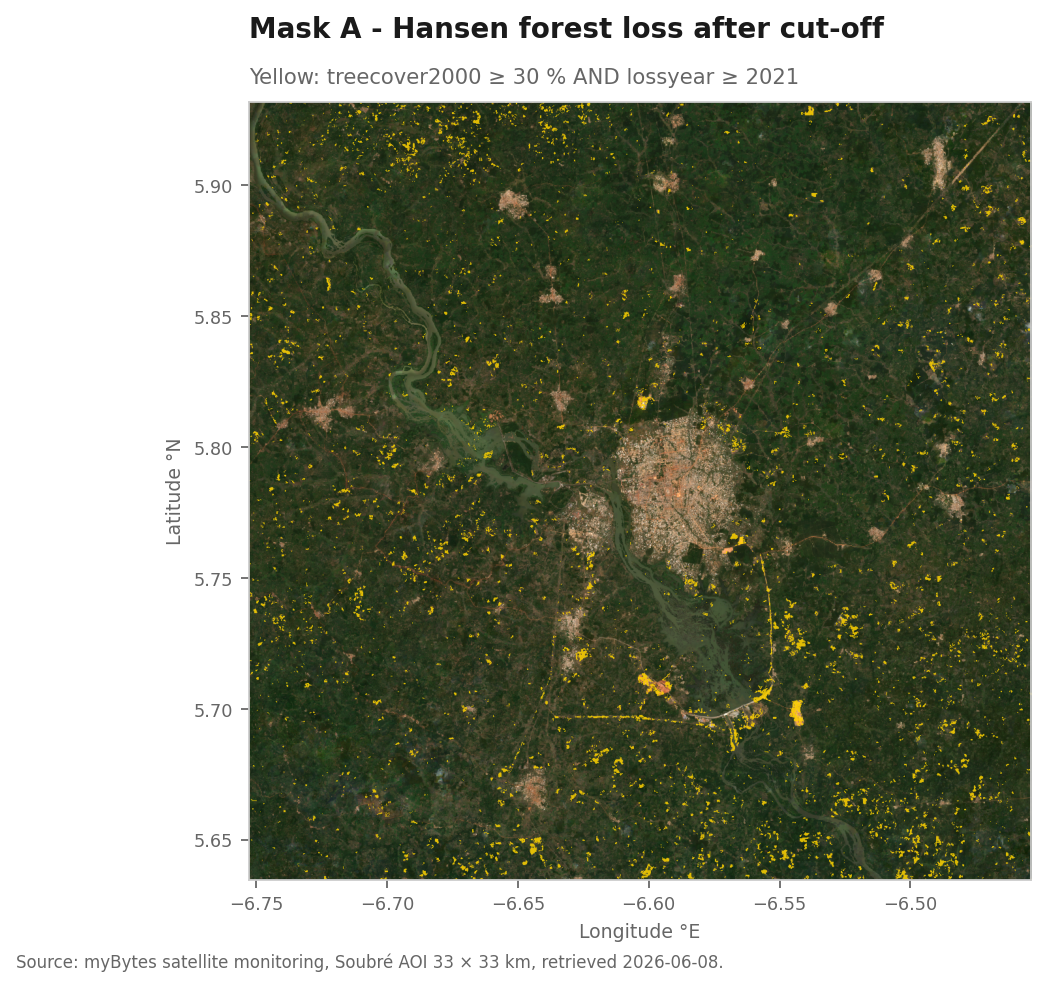
Hansen encodes the year 2000 + k as an integer k. The condition selects pixels that
were forest in 2000 and have lost forest since 2021. The forest-baseline filter is not
optional; without it the mask would also count loss of savanna, cropland or built-up areas as “deforestation”,
which the EUDR explicitly does not mean.
Hansen is not perfect; it measures tree-canopy loss, not necessarily deforestation in the legal sense. But it is the source every auditor knows, and it is public.
2.2 · Mask B, present plantation with probability above threshold
For cocoa in West Africa the relevant plantation-probability layer is the
Forest Data Partnership cocoa model 2025a, hosted on Google Earth Engine at
projects/forestdatapartnership/assets/cocoa/model_2025a. The FDP model builds on the methodology
of
Kalischek et al. 2023, Nature Food
and is provided as a separately maintained Google asset. Mask B selects pixels whose FDP cocoa probability P
reaches or exceeds the threshold τ.
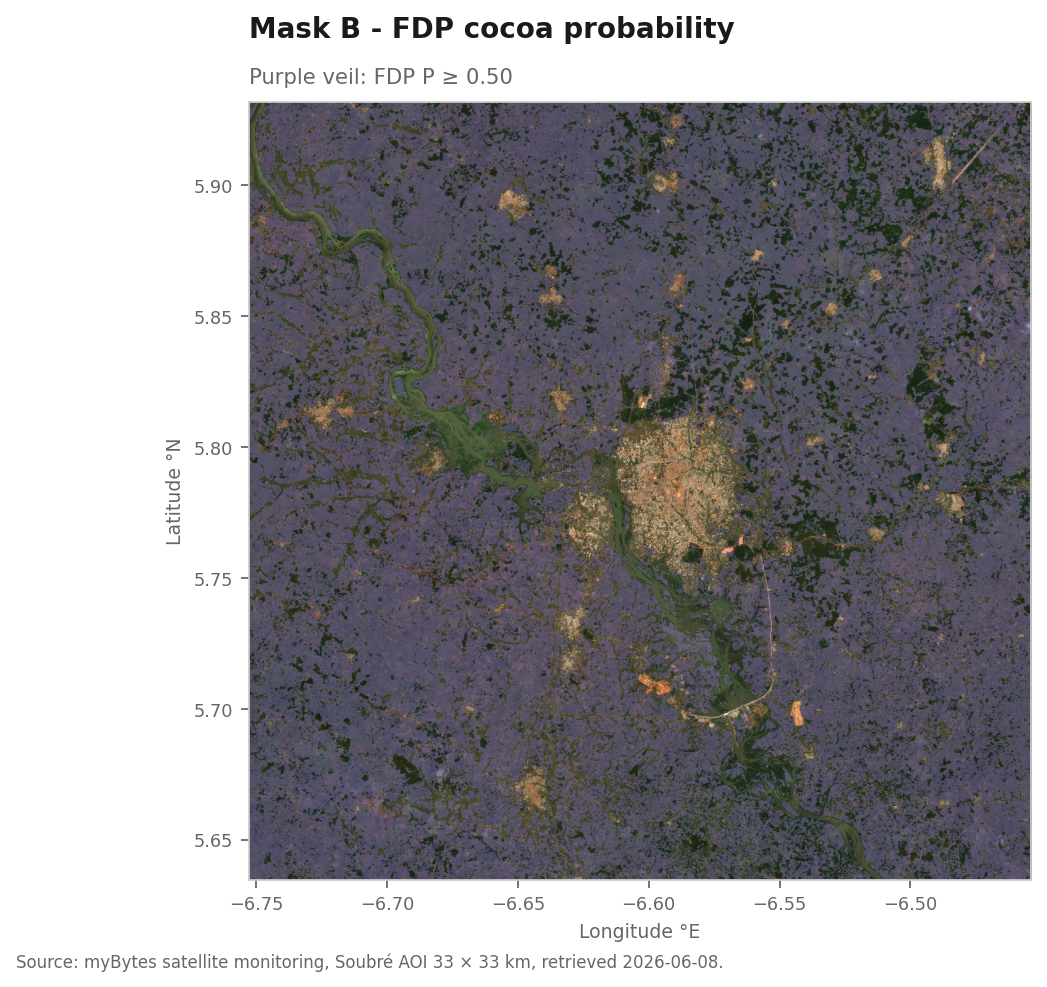
with τ = 0.50 as the default value of our satellite monitoring.
Analogous plantation-probability layers exist for the other six EUDR commodities. Soy via MapBiomas + Trase in Brazil, palm oil via the contributions of Gaveau et al. and Descals et al., timber and cattle via FAO Forest Resources Assessment connections.
The choice of τ is a deliberate decision, not a natural constant. Anyone who leaves τ unnamed has no scientific methodology but a hidden lever. A serious monitoring must calibrate τ against independent ground truth following Olofsson et al. 2014 RSE and publish a sensitivity analysis across τ ranges.
2.3 · The AND operation
The EUDR risk pixel is defined exactly where mask A and mask B apply simultaneously, that is, where forest loss has occurred since 2021 on a pixel that today counts as a cocoa plantation.
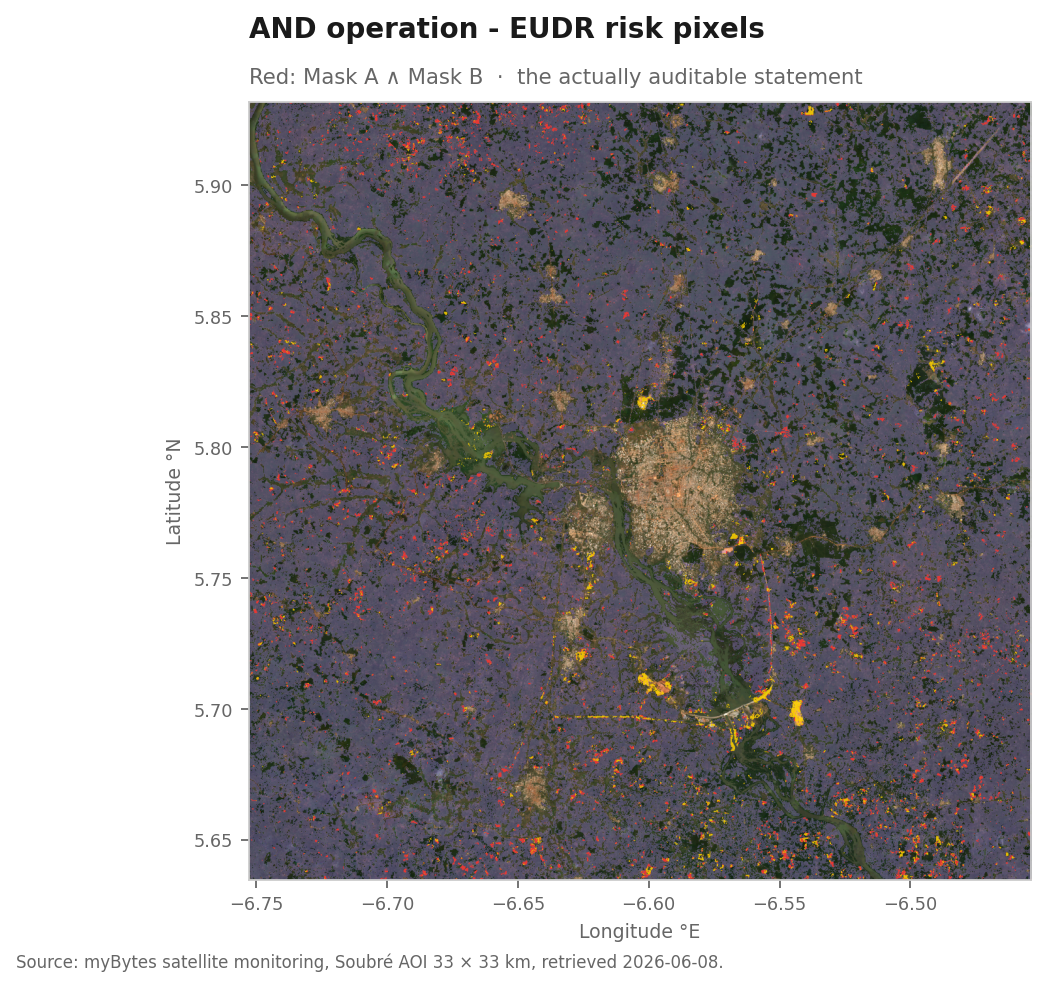
That is the whole operation. The methodological substance lies not in algorithmic complexity but in the per-pixel auditability that follows from this triviality. Every pixel classified as risk carries two reconstructible values: the Hansen year and the probability value of the plantation layer.
2.4 · The generalization beyond cocoa
The same two-mask operation holds for all seven EUDR commodities. Mask A stays unchanged. Hansen is commodity-agnostic. Mask B is replaced by the respective plantation-probability layer. For soy in Brazil, for example, the substitution is straightforward: MapBiomas provides the land-cover classification, the 2006 soy moratorium forms a historical cut-off anchor that works in parallel with the EUDR cut-off.
What does not work is marketing a monitoring that was parameterized only for cocoa as a universal solution. Mask B is commodity-specific; this must be stated explicitly in the methodology documentation.
3 · Auditability, not map beauty
A map is a visualization format. It is not the audit.
An audit-grade EUDR output must deliver three statement layers simultaneously, and all three are directly derivable from our two-mask operation:
At pixel level. Every pixel classified as risk references a concrete Hansen
lossyear value, a concrete GFC tile ID, a concrete probability value of the plantation layer and
the τ used. These five values are enough for an external reviewer to follow the calculation, without having to
rely on a provider's software.
At delivery-polygon level. Aggregating the pixels over the geo-polygon given by the supplier yields a share and an absolute area of the EUDR risk pixels within that delivery unit. This is exactly what Article 10 requires: a documented, quantitative risk value per plot. This becomes methodologically clean only with two statistical additions, namely the τ sensitivity and the Olofsson-compliant confidence-interval calculation.
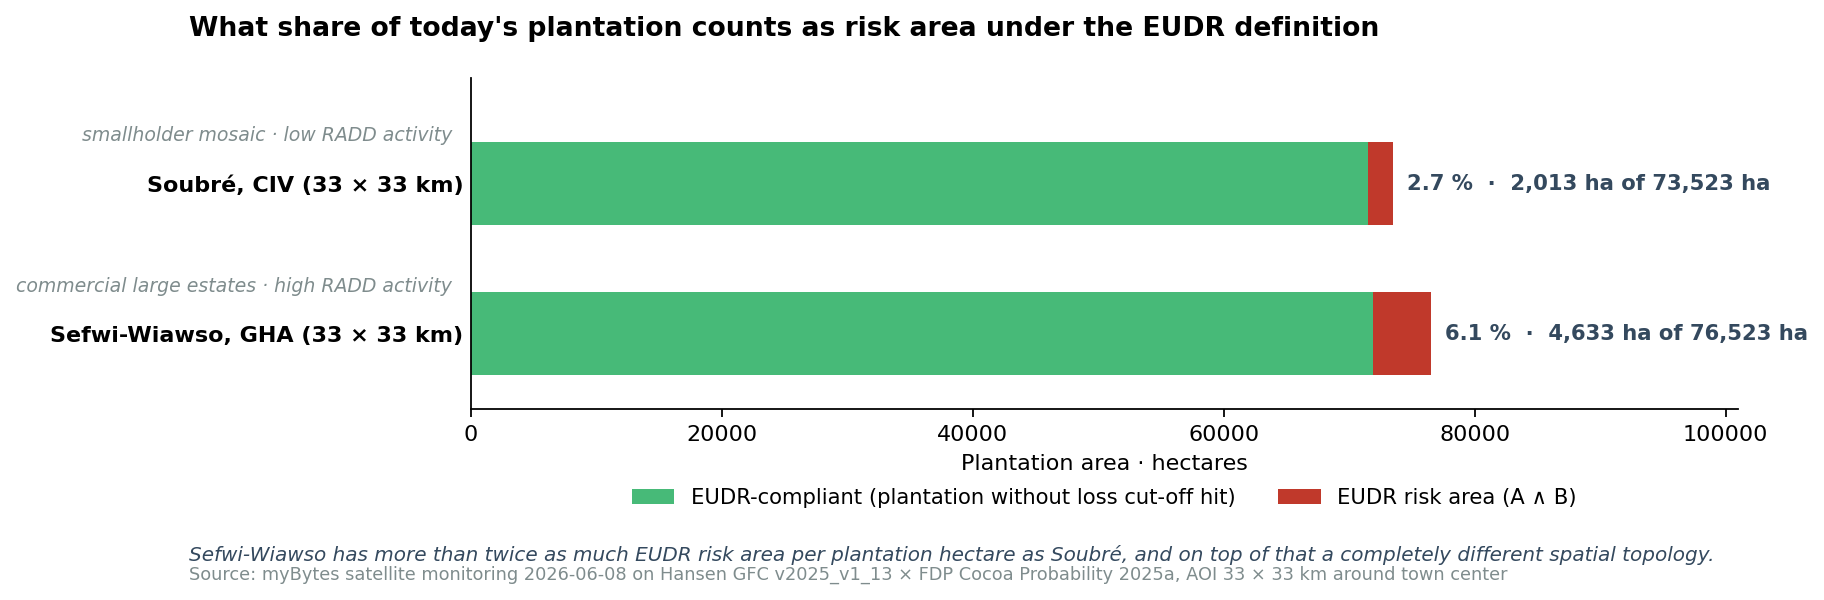
At regional level. Aggregating further over all polygons of a region yields an industry benchmark. Anyone buying in high-risk regions has higher volumes of unaudited supply chains and a higher expected reputational risk. Figure 2 shows the picture for Soubré and Sefwi-Wiawso from our satellite monitoring of the cocoa-belt regions as of 8 June 2026, on real Hansen GFC v2025_v1_13 and FDP cocoa probability 2025a layers. The two regions differ not only in the risk rate but in spatial topology. Soubré is a smallholder mosaic with many small scattered loss patches; Sefwi-Wiawso is a large-estate belt with commercial block structures and correspondingly higher RADD alert density in recent months.
To arrive at these statements, at myBytes we ran a concrete experiment: two 33 x 33 km AOIs in the West
African cocoa-belt region, centred on Soubré in Côte d'Ivoire and Sefwi-Wiawso in Ghana, evaluated against the
publicly available Hansen GFC v2025_v1_13 and FDP cocoa probability 2025a layers, applied the two-mask
operation with τ = 0.50 and a treecover2000 threshold of 30 %, and persisted the result as auditable snapshot
CSVs. The complete code, the exact asset paths on Google Earth Engine and the reproduction notebooks are in
the companion repository
github.com/myBytesResearch/eudr-risk-pipeline.
An assert block in notebooks/00_reproduce_article_numbers.ipynb checks, on the reader's run,
whether the 2.74 % and 6.05 % cited here reproduce exactly from the snapshot, as a publication gate against
drift between article and monitoring output.
4 · What mask A and mask B do not see. Limitations
The operation is methodologically trivial. Its robustness limits are not trivial, and they must be named explicitly.
Cloud cover over tropical regions. Optical Sentinel-2 layers work in the West African cocoa-belt region only in a fraction of the year. Hansen solves this through multi-year composites, FDP through Sentinel-1 SAR integration; both strategies have documented assumptions that must lie open in a sensitivity analysis.
Threshold sensitivity. Shifting τ by 0.05 can move the risk-share statement considerably. Anyone publishing Figure 2 without a confidence band has not defended the τ choice. A serious monitoring output must print τ sensitivity.
Smallholder polygon granularity. A region-of-interest aggregation over 33 x 33 km is a different statistical object than a delivery-polygon aggregation over 2 hectares. Both are valid, but they mean different things. Anyone who does not separate them answers the wrong question.
Forest-versus-plantation transition zones. False positives concentrate at the edges of plantation-to-natural-forest transitions. An IoU validation against the Kalischek map at exactly this transition cohort is mandatory, not optional.
Hansen annual versus RADD weekly. Mask A uses Hansen because Hansen is the established historical reference. But for operational early warning, Sentinel-1 SAR RADD alerts (Reiche et al. 2021, ERL) are orders of magnitude more current. A complete EUDR monitoring combines both and documents the reconciliation rule.
These points are not weaknesses that make the method unusable. They are the places where a monitoring is methodologically tested. A method that does not name its own limits is not science but advertising.
5 · The assessment reversed: six questions you must ask your provider
From the previous sections an assessment grid can be derived that applies equally to one's own monitoring, to an existing provider and to a new pitch. The questions are not a wish list but consequences of the two-mask operation and the three aggregation levels:
- Which plantation-probability layer does the provider use, and against which ground truth is that layer validated with IoU, precision and recall?
- Which τ is used, and which sensitivity range is rendered in the output?
- Is an audit trail per pixel exported into the due-diligence statement, or only an aggregate score?
- Are Hansen and RADD evaluated in parallel, and if so, which reconciliation rule is applied when the two sources conflict?
- What happens at cloud cover > 60 % over an AOI? Is the calculation degraded, suspended, or marked with lower confidence?
- Is the whole monitoring reproducible, code, data versions, seeds, by an external reviewer in ≤ 6 steps?
Anyone who fails to provide a documented answer to four or more questions is not in a position to guarantee EUDR compliance, however pretty the maps are. This is the identical assessment grid we apply to every AI research publication in the Truth-Check Protocol. For EUDR providers it applies exactly analogously.
6 · Reading list & companion repository
Reading list (seven sources, in this order):
- Regulation (EU) 2023/1115, Official Journal of the European Union L 150/206, 9 June 2023.
- European Parliament, press release 17 December 2025, second postponement + simplifications.
- Hansen et al. (2013), “High-Resolution Global Maps of 21st-Century Forest Cover Change” Science 342 (6160), 850-853.
- Kalischek et al. (2023), “Cocoa plantations are associated with deforestation in West Africa” Nature Food 4, 384-393.
- Reiche et al. (2021), “Forest disturbance alerts for the Congo Basin using Sentinel-1” Environmental Research Letters 16.
- Olofsson et al. (2014), “Good practices for estimating area and assessing accuracy of land change” Remote Sensing of Environment 148, 42-57.
- Directive (EU) 2024/1760 (CSDDD), Official Journal of the European Union, parallel due-diligence obligation, in the version substantially postponed and simplified by the Omnibus Directive (EU) 2026/470 of 26 February 2026 (transposition 26 July 2028, application 26 July 2029, thresholds over 5,000 employees and over EUR 1.5 billion).
Companion repository:
github.com/myBytesResearch/eudr-risk-pipeline,
a minimal, runnable reference implementation of the two-mask operation and the audit-trail format. Licence: MIT
for code, CC BY 4.0 for content. Forks and pull requests welcome.
Closing
The EUDR is not a technical regulation calling for a ready-made provider solution. It is a burden of proof that demands a methodology an auditor, an insurer, a wholesaler and an NGO can accept at the same time. This methodology is not complicated. But it is consistent: two public data layers, one logical link, a complete audit-trail documentation and three named aggregation layers.
Whoever offers that runs an EUDR monitoring. Whoever offers maps has a map service. Both have a value. But only one of them fulfils the regulation.
Disclaimer
This article summarizes regulations and interpretations as the author understands them after his own research and as of June 2026. It does not replace legal advice. Cited article numbers and deadlines are to be checked against the primary sources linked in the reading list. Binding statements on the EUDR compliance of your specific supply chain require the involvement of competent legal counsel.Data and licence notes
The evaluation combines several external data layers whose licences have different commercial-use conditions. The exact licence texts, the latitude between free use and commercial restriction, and the respective clarification addresses are documented in the companion repositoryeudr-risk-pipeline
in the README.md and in each data/runs/<date>/README.md. Anyone applying the
methodology to their own data or redistributing results should read these notes before any publication.