Fashion Intelligence
What fashion returns really cost, and whether predicting them pays
Recomputed on 2.33 million real order line items: returns prevention in fashion sits right on the economic edge - and whether it pays is decided by a single cost figure that almost everyone gets wrong.
The common story is seductive: returns cost a fortune, so you train a model that predicts the return, intervene early, and save millions. We recomputed that on 2.33 million real order line items from an online fashion retailer. The result is more sober, and more useful for any buying or data team than the promise: prevention sits right on the economic edge, and where it lands is decided by a single number that almost everyone gets wrong.
1 · The first correction is about the cost, not the model
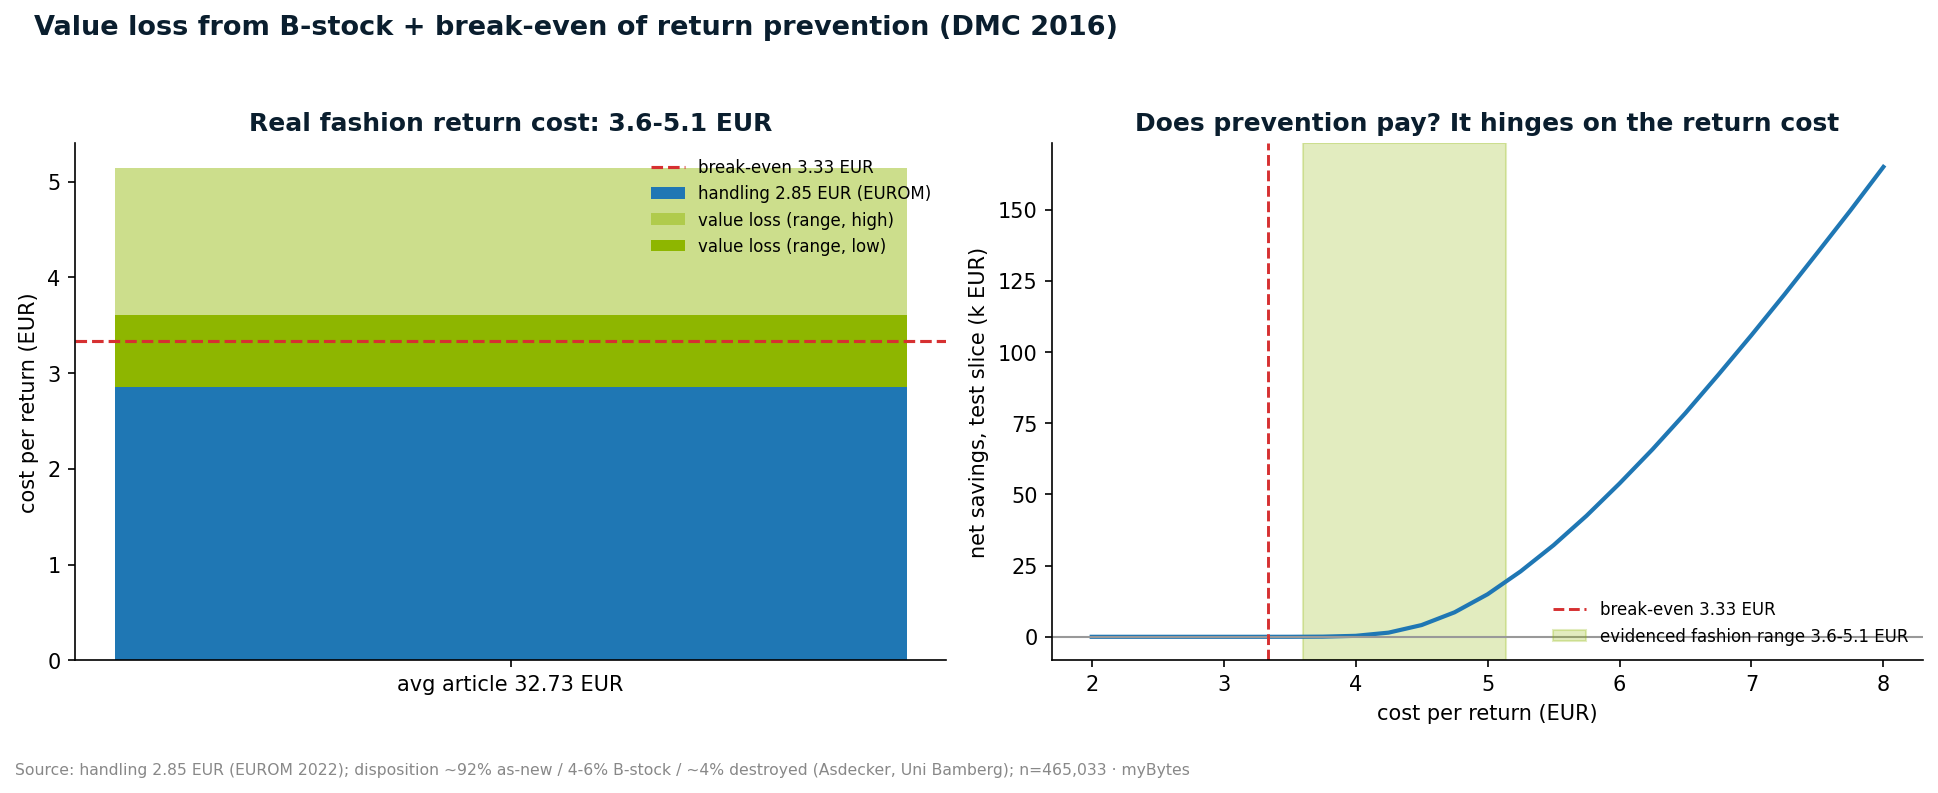
For years the figure circulated that a return costs the retailer 10 to 15 euros. The largest European retailer survey to date clears that up: transport and handling average 2.85 euros per return, not double or triple that. That figure, however, does not yet include the loss in value.
We quantified that separately. Of the returned items, around 92% come back as good as new for resale, about 4 to 6% become B-stock with a markdown, and around 4% end up destroyed. Weighting this with the dataset's real item prices (32.73 euros on average) yields a loss in value of 0.75 to 2.29 euros per return. The honest total-cost range for fashion is therefore 3.60 to 5.14 euros per return, not 10 to 15.
This number is not a detail. It is the lever the entire calculation hangs on.
2 · The break-even nobody reports
An intervention costs money (a size consultation, a nudge, a manual check step), and it prevents the return only in some of the cases. If you set the intervention cost at 1 euro and the prevention rate at 30%, a return must cost at least 3.33 euros for intervening to save any money at all. Below that, you lose money on every prevented return.
The documented fashion cost range (3.60 to 5.14 euros) sits just above this break-even. In concrete terms:
- Counting only handling (2.85 euros), prevention does not pay (net roughly zero; the model effectively recommends doing nothing).
- Counting the loss in value fully (5.14 euros), the model returns around 19,300 euros net over our test window, about 1.6% of the return costs of this slice.
Whether ML-based returns prevention pays in fashion is therefore not a question of the model, but of how the loss in value is booked. Whoever ignores B-stock and destruction concludes "does not pay"; whoever counts them in concludes "barely pays". Both are far from the millions promise.
3 · The model, and the honest difference from a polished showcase
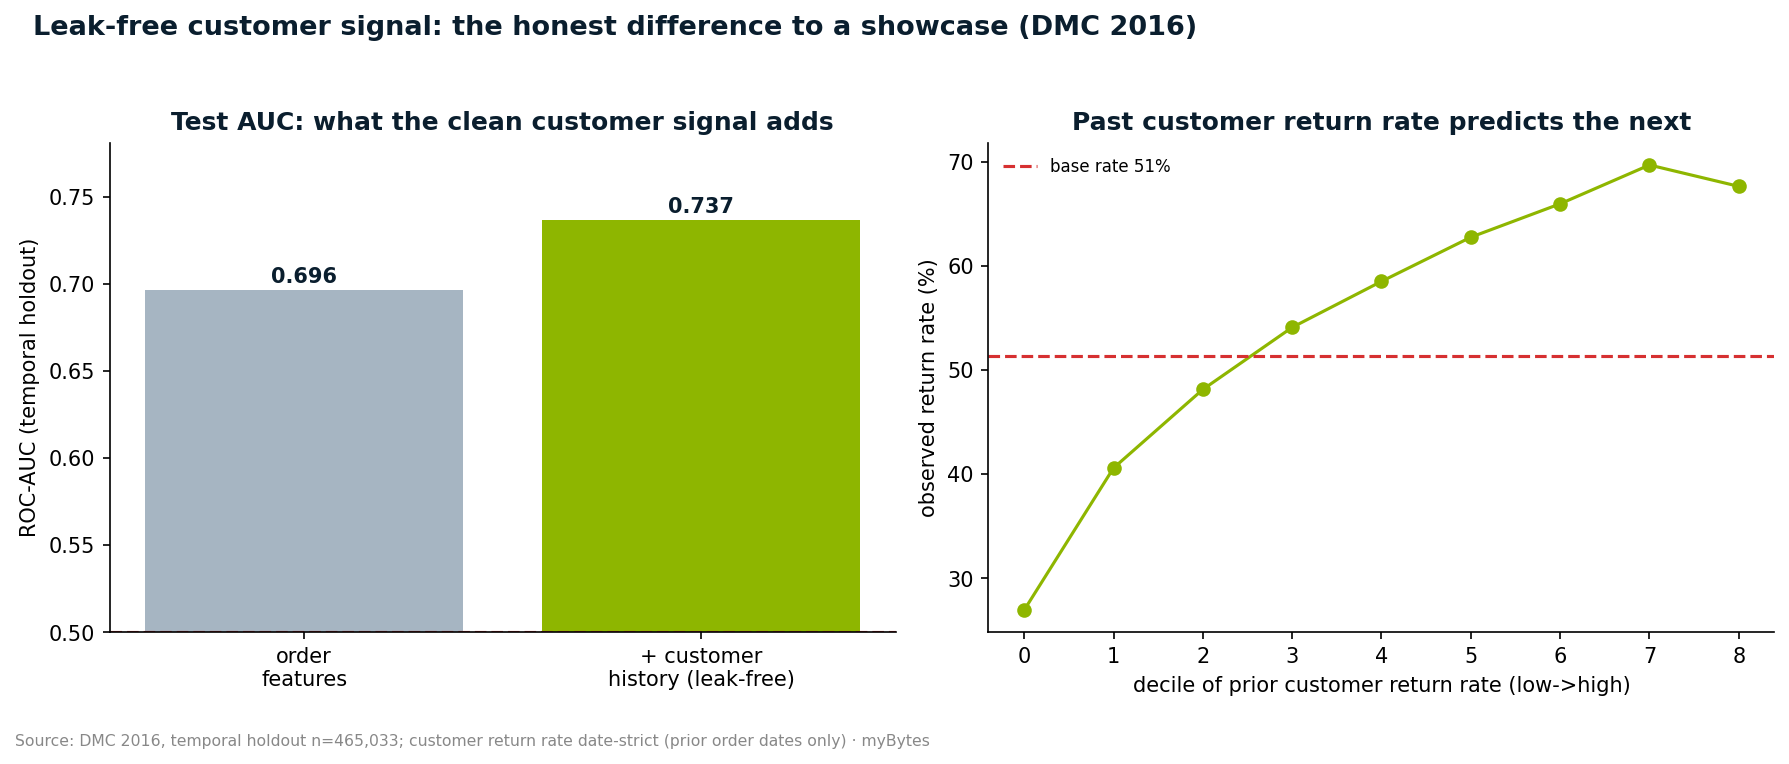
On order data alone (item, price, discount, payment method, basket), a gradient-boosting model reaches a ROC-AUC of 0.696 on a temporal holdout, well calibrated. That sounds unspectacular, and this is exactly where many public showcases drift upward.
The reason is usually the same: the strongest signal is the customer's own return history, and this signal leaks trivially if you compute it across the whole dataset or on a random split. We built it date-strict, that is, only from orders with an earlier date, excluding the current order. Built cleanly, it lifts the AUC to 0.737 and nearly doubles the net saving. If a showcase sits well above that (say 0.80), the difference from our 0.737 is most likely the leakage premium, not real added value.
That is the real message to decision-makers: a high reported accuracy is not interpretable without a clean temporal split and without leakage-free features.
4 · Size bracketing: the concrete lever, honestly measured
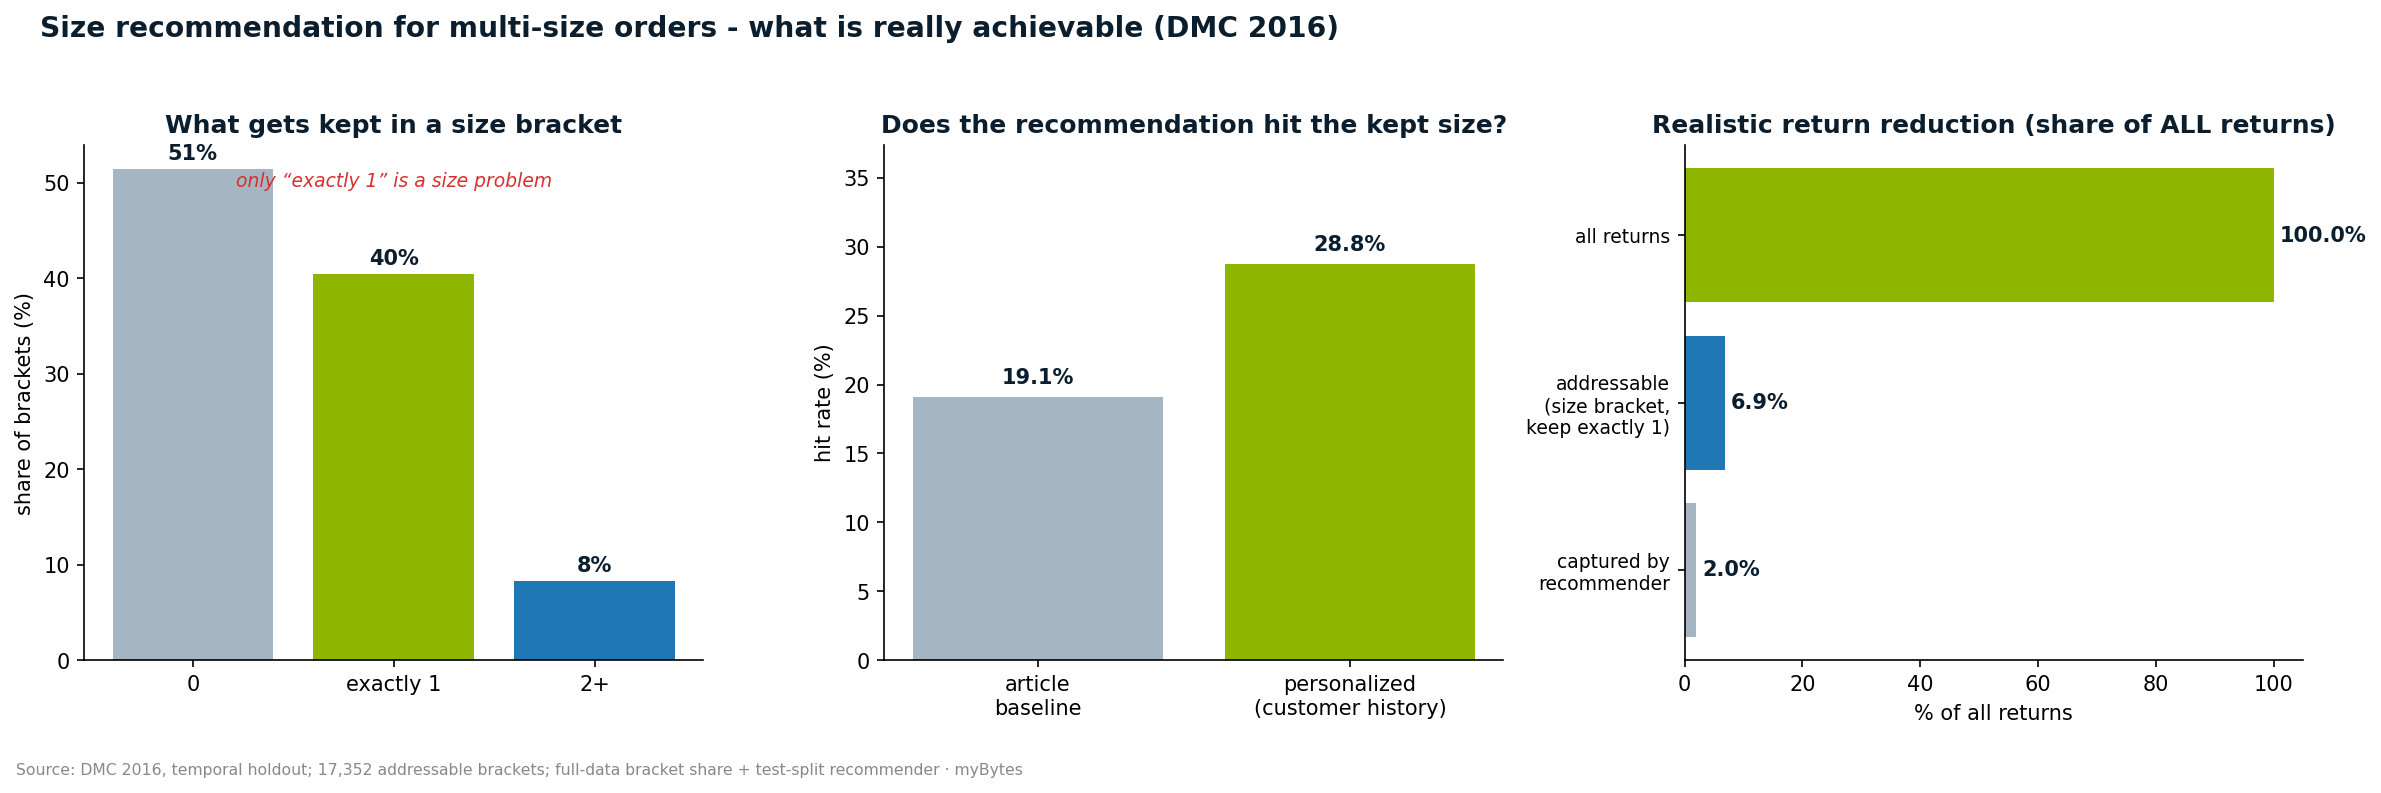
A widespread promise is that personalised size recommendation cuts returns by 25%. We tested that against bracketing behaviour: customers order the same item in several sizes, keep one, and send the rest back.
- 16.6% of all line items are such size brackets, with a return rate of 73%; they account for 23.5% of all returns.
- But only where exactly one size is kept (around 40% of brackets) is it a sizing problem at all. In a good half, nothing is kept - that is a product or taste problem that no sizing logic solves.
- A leakage-free, personalised size recommender hits the kept size in 28.8% of cases (versus 19.1% for a plain item baseline, so clearly better). What this realistically captures is around 2% of all returns; the theoretical ceiling is 6.9%.
So it is not 25%, and with size recommendation alone it cannot be. Personalisation has a demonstrable effect; the lever is just smaller than advertised.
→ The size lever measured in depth: What size recommendation actually does against returns.
5 · The strongest counter-position
The strongest rebuttal: we underestimate the benefit because we do not model the full fashion loss in value (seasonal goods, items returned multiple times, brand stock sent for destruction) or pricier premium ranges; there the return cost rate rises clearly above our range, and the calculation tips more firmly into the positive. That is true, and it is exactly why we report a range and a break-even instead of a single figure: in high-price segments, prevention pays earlier and more strongly. The core message stands - the economics hang on the cost rate, not on the model.
6 · What this article does not cover
No causal model of the intervention (the 30% prevention rate is an explicit assumption, not a measured effect). No body or fit data, only purchase and return behaviour. A single retailer dataset (DMC 2016), no industry generalisation. And no sustainability argument, although the 4% destruction would be the obvious starting point for one.
Reproducibility
All figures stem from the public DMC 2016 dataset via the scripts in the companion repositories
fashion-returns-analysis
(EDA, model, leakage-free customer feature, cost sensitivity) and
fashion-size-fit-prediction
(size recommender). The raw data is not shipped for licensing reasons, but reproduced via a loader from the
Kaggle download.
Notice
This is not legal or business consulting, but a methodological research state on a public dataset (research date: June 2026). Cost rates, ratios and assumptions should be checked against your own figures before any operational decision.Sources
- European Return-o-Meter (EUROM), B. Asdecker, University of Bamberg, 2022 (handling/transport cost 2.85 euros per return): uni-bamberg.de
- Return destruction (~4%, ~20M items/year; 80% below 15 euros), B. Asdecker, University of Bamberg: uni-bamberg.de
- EHI study on return rates (Textilwirtschaft): textilwirtschaft.de
- bevh returns compendium (ed. G. Heinemann): bevh.org
- Data basis: Data Mining Cup 2016 (online fashion returns), via Kaggle.