Research methodology
The single-GARCH limit on soft commodities
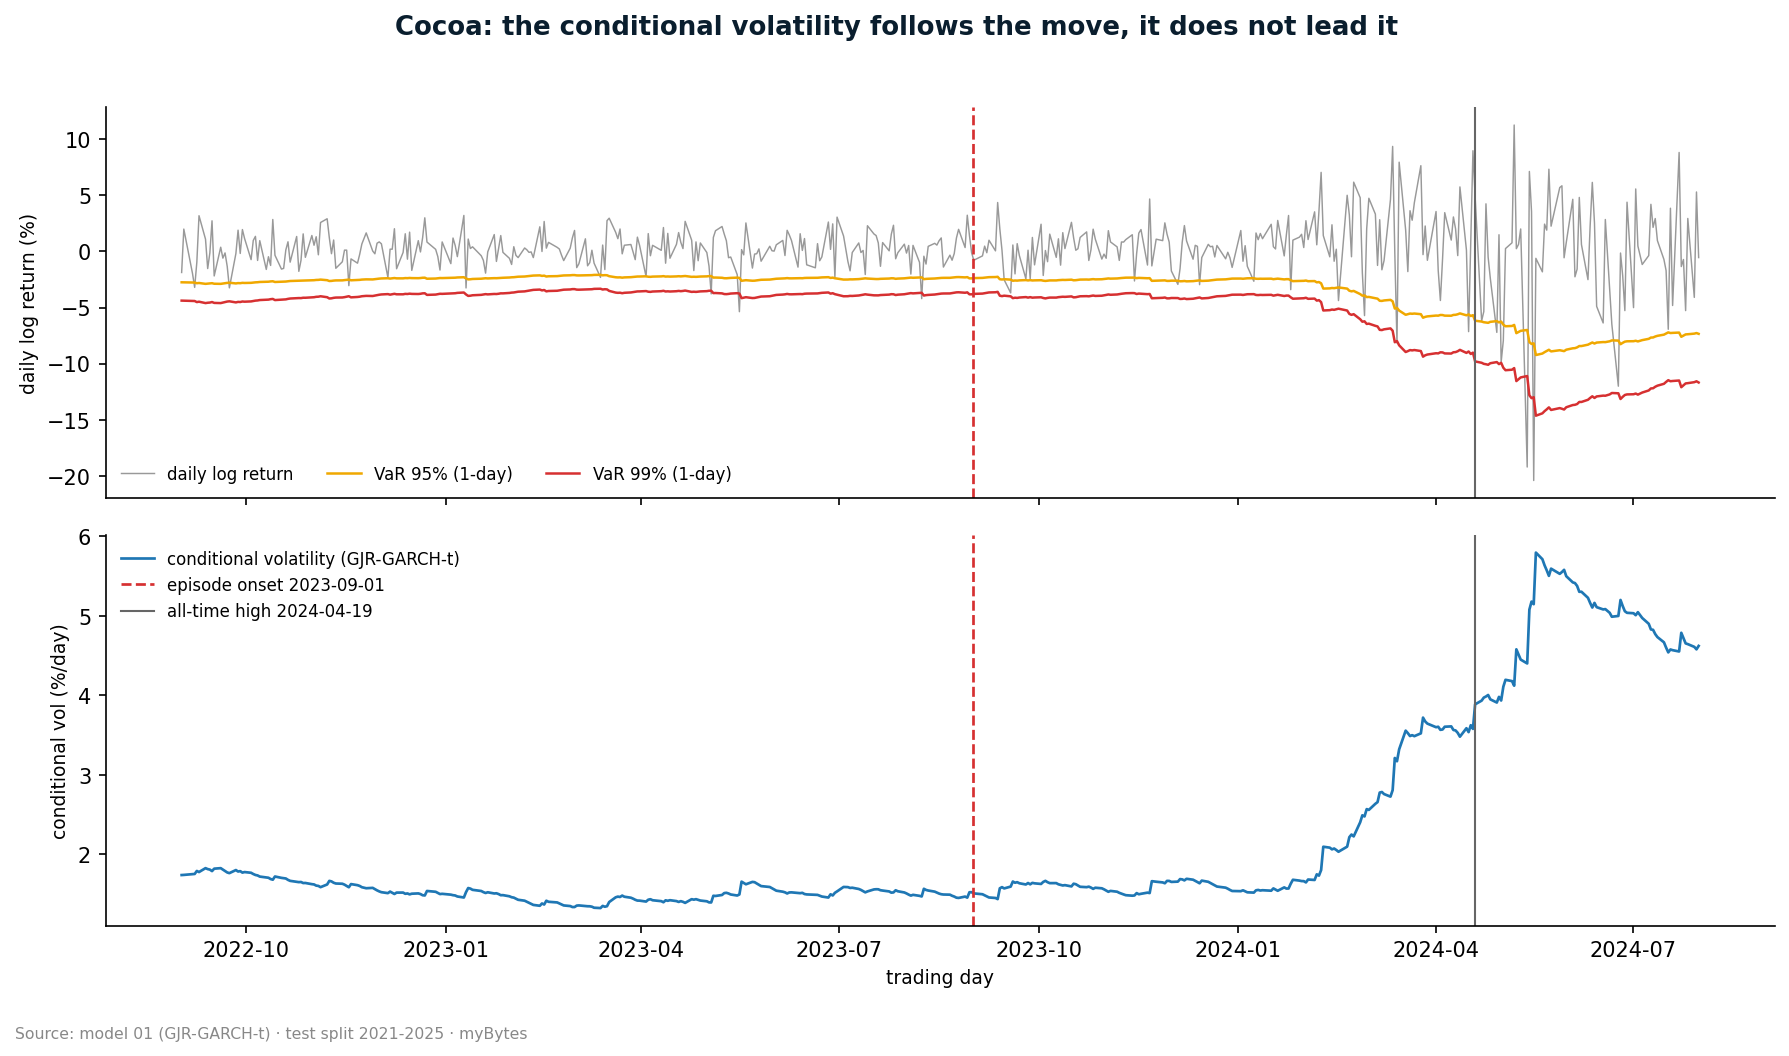
A classical GJR-GARCH-t passes the VaR discipline on four ICE soft-commodity continuous futures. It delivers no early warning: the conditional volatility follows the move, it does not run ahead of it. Both statements are methodologically evidenced; from both follows what is built next.
Volatility models for soft commodities are often presented in provider decks as finished stacks, without the backtest numbers being checked. We go the other way. We build each model individually, document the implementation, run the walk-forward backtest against a fixed snapshot and publish the finding. Even when it does not flatter.
This article summarizes what our first fully built model layer shows: a GJR-GARCH(1,1) with Student-t innovations, identically specified on four ICE continuous futures (Cocoa, Coffee, Sugar, Cotton), walk-forward 2019 to the end of 2024. It is phase 1 of a multi-year research programme on soft-commodity volatility.
1 · The model and the setup
We use the same specification for all four commodities: a classical GJR-GARCH(1,1) with Student-t innovations (Glosten/Jagannathan/Runkle 1993). GJR-GARCH-t is the industry standard for asymmetric volatility modelling. Anyone building a model stack starts here. Otherwise they have nothing against which the later layers can be measured.
Concretely:
- Data: ICE continuous futures via
yfinance(CC=F, KC=F, SB=F, CT=F), daily closing prices, frozen to a snapshot end date - Returns: logarithmic returns, scaled to per cent (×100), the convention of the arch package for numerical stability
- Split: walk-forward with an expanding training window (initial ≈ 10 years), refit every 21 trading days, 1-day forecast horizon
- Tracking: an MLflow run per refit, with configuration hash, data snapshot hash, all parameters, all metrics, forecast parquets as artefact
Pre-registered. No specification search per asset, no asset-specific p/o/q variations. This discipline is deliberate. Specification searches over walk-forward backtests are a known source of data snooping.
The complete implementation, all configurations, all diagnostics JSONs and an extensive research notebook are
in the companion repository
soft-commodities-forecast-benchmark.
Reproduction with a single command: make reproduce.
2 · What the VaR discipline shows
We check the model on each of the four commodities against three tests established in the risk-management literature:
- Kupiec POF at 95 % and 99 % (Kupiec 1995)
- Christoffersen CC (Christoffersen 1998)
Over the aggregate test periods 2019-2024 all four commodities pass the VaR discipline: violation frequencies do not deviate significantly from the nominal level at any tested level (smallest p-value across the asset class: 0.115, cotton, Christoffersen CC at 99 %). ARCH effects are massively evidenced on the training periods for all four commodities with p-values smaller than 1·10⁻¹⁸. The GARCH family is thereby methodologically clearly justified.
On the scale that the VaR backtest discipline covers, the baseline is clean. What the aggregate view hides is shown by the next section.
3 · What the VaR discipline does not show
GJR-GARCH is a model that adjusts after a crisis. It reacts to the first large negative return by raising the conditional variance in the next step. Exactly this responsiveness secures its VaR coverage over the aggregate periods.
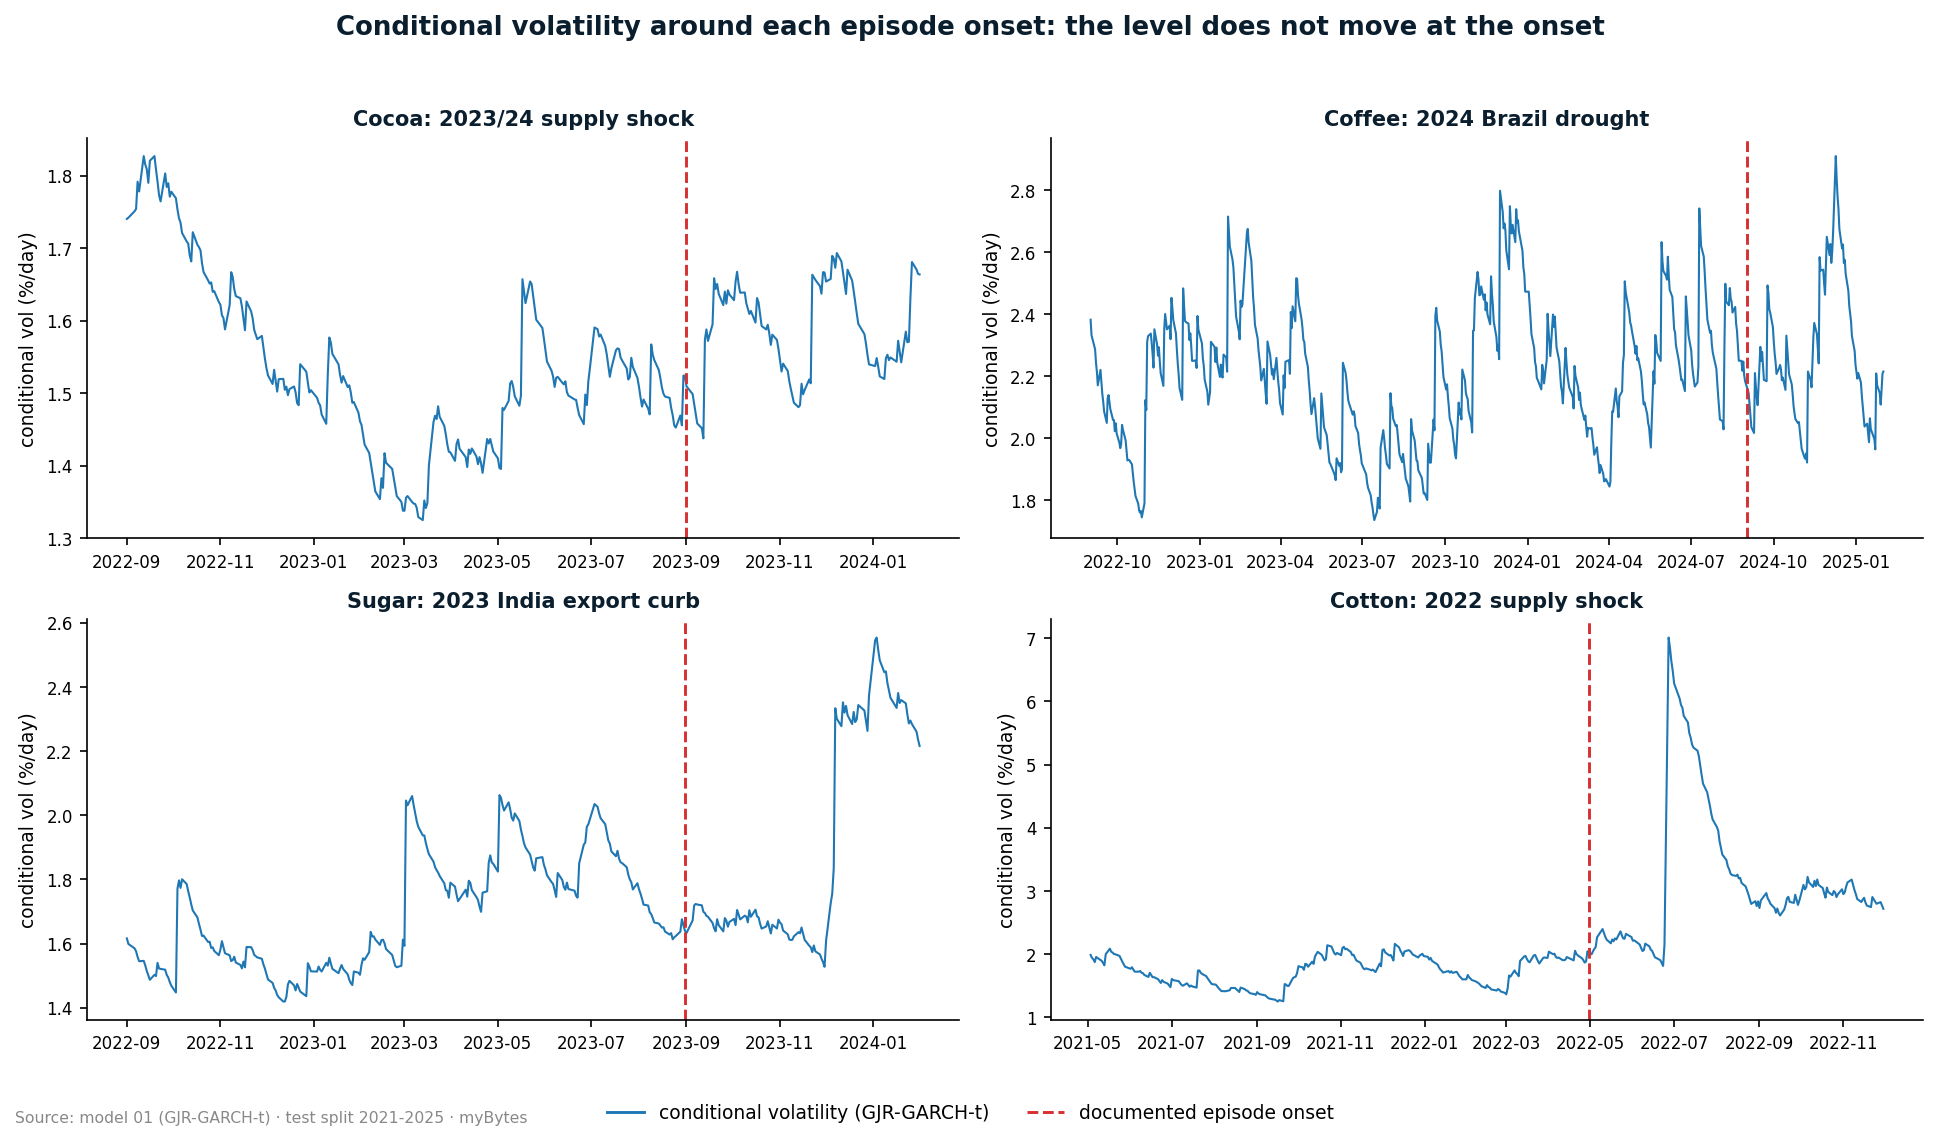
We check this on the four known stress episodes, each at the documented episode onset (external anchors in
configs/global.yaml of the companion repository):
| Commodity | Stress episode | Conditional volatility at episode onset |
|---|---|---|
| Cocoa | 2023/24 supply shock (onset 2023-09) | unchanged: 1.52 %/day (60 days before) versus 1.57 %/day (60 days after); the rise above 5 %/day comes only with the large moves from February 2024 |
| Coffee | 2024 Brazil drought (onset 2024-09) | flat in the 30 trading days before the largest daily move (ratio to the 60-day trend: 0.97) |
| Sugar | 2023 India export curb (onset 2023-09) | flat before the largest daily move (0.97); a rise by a factor of 1.45 only in the days after |
| Cotton | 2022 supply shock (onset 2022-05) | a rise by a factor of 3.2 only at the largest daily move (2022-06-24), not before |
The pattern is the same across all four commodities: the conditional volatility catches up once the move is there. It does not announce it. Whether lead can nevertheless be gained from the signal with other evaluation methods, and where such lead-time metrics break methodologically, we treat in full in the follow-up article on the second model layer.
make reproduce.
This is no surprise and no failure, and it is also no new insight: the reactivity of classical GARCH models is textbook knowledge. The value of this work lies in the fact that the finding here is pre-registered, measured identically across four markets and fully reproducible. It is the expected finding for a classical GARCH model without regime detection. Whoever works operationally with it has a defensible risk quantile over aggregate periods. But they have no model that fires before the episode onset.
A further order of magnitude that belongs to the honest picture: the out-of-sample R² against squared returns lies between −0.01 and +0.03 for all four commodities. This is behaviour known since Andersen/Bollerslev 1998 and belongs to every methodologically honest discussion of GARCH quality. Squared returns are a notoriously noisy proxy for realized volatility.
4 · What follows from this and what is built next
From the cross-asset finding follows a clear methodological position:
A single GARCH is a necessary but not a sufficient component. It delivers the VaR discipline but no early warning. Anyone who wants an early warning needs a second layer for it. This finding is consistent across four commodities. It is therefore not a peculiarity of an individual case but a structural property of the GARCH family.
The literature knows three main candidates for the second layer:
- Markov-switching GARCH (Hamilton/Susmel 1994), explicit regime detection via latent Markov states
- Hidden Markov models directly on returns (Rabiner 1989; econometric regime-switching tradition: Hamilton 1989), regime detection without explicit volatility modelling
- GARCH-MIDAS with exogenous low-frequency factors (Engle/Ghysels/Sohn 2013), integration of weather, COT and macro data into the volatility specification
These three strands are planned as follow-up stages in our research programme. A literature-grounded expectation for the lead time of a combined HMM-plus-GARCH-MIDAS architecture lies in the range of one to four weeks ahead of a crisis regime switch (Ang/Bekaert 2002, Pan/Wu 2020).
We claim no lead-time numbers of our own for these models today. They do not yet exist in our backtests. When they exist, the next layer gets its own companion repository, and this article will be extended by a methodological addendum publishing the real backtest numbers with a reproducibility hash.
5 · Steel-man: “foundation models could have done it better”
A plausible counter-position: “Instead of building classical GARCH, you should use a time-series foundation model, such as TimesFM, Chronos or Moirai.” The reflex is understandable. Three answers:
- Volatility is not a price forecast. Foundation models are trained on price-level forecasts, not on conditional variance. The transfer to volatility targets is methodologically non-trivial and still unresolved in the literature.
- Reproducibility is part of the discipline. GARCH families have been established in risk research for thirty years. Anyone publishing a GARCH backtest can refer to a consistent method tradition. With foundation models we have to stabilize much ourselves.
- Both are sensible, in this order. A later stage of our programme is expressly dedicated to the foundation-model layer, with a dedicated leakage-detection check. The baseline comes first.
6 · What this article does not do
Four methodological caveats that belong to the candid picture:
- One stress episode per commodity. The pre-crisis window evaluation rests, per commodity, on a single stress episode. A real validation requires several episodes per asset. One episode is not a sample.
- Look-ahead in the event definition. We now know which episodes were stress. A model that had warned in real time would not have known the date in advance.
- Model specification is fixed. We use GJR(1,1)-t for all four commodities, no asset-specific search. This is discipline against data snooping, not a model defect.
- Data quality via Yahoo. Yahoo continuous futures are methodologically sufficient but not Tier-1 market data. For productive risk applications a licensed commercial data feed is preferable.
The complete limitations list with further points (roll mechanics, backend dependence of the optimization,
missing cross-correlation evaluation) is in
docs/limitations.md
in the companion repository.
Two points were added in the course of the scientific audit of 11 June 2026 and belong permanently to the honest picture:
- The calibration period is not crisis-free. The threshold calibration uses the years 2019-2020 as a calm reference; the COVID spring of 2020 lies within it. The calibration is therefore conservative; detection statements are more likely under- than overstated.
- One stress episode per commodity. Every episode-related statement rests on exactly one event per market. Validation against further historical episodes is outstanding.
7 · Reading list
- Glosten/Jagannathan/Runkle 1993, Relationship between Expected Value and Volatility, the original GJR-GARCH work.
- Bollerslev 1986, Generalized Autoregressive Conditional Heteroskedasticity, the GARCH family.
- Andersen/Bollerslev 1998, Answering the Skeptics, the methodological discussion of the squared-return proxy question.
- Kupiec 1995, Techniques for Verifying the Accuracy of Risk Measurement Models, Kupiec POF.
- Christoffersen 1998, Evaluating Interval Forecasts, Christoffersen CC.
- Hamilton 1989, A New Approach to the Economic Analysis of Nonstationary Time Series, the HMM original, anchor of the next research stage.
- Engle/Ghysels/Sohn 2013, Stock Market Volatility and Macroeconomic Fundamentals, the GARCH-MIDAS original.
Related articles
- The second layer: what a regime model really delivers in lead time, the follow-up article that redeems the second model layer announced here.
- A Truth-Check Protocol for AI research output, the methodological review template we apply to every published claim.
Companion repository
myBytesResearch/soft-commodities-forecast-benchmark,
complete code, all four commodity configurations, diagnostics JSON per asset, an extensive research notebook,
MLflow tracking, a make reproduce pipeline. Private at publication time; the visibility flip to
public is a separate decision.
Disclaimer
This article describes a walk-forward backtest from our own research practice. It is neither investment nor hedging advice. The backtest numbers cited refer to a specific test-setup configuration and are not readily transferable to other application scenarios.make reproduce pipeline, MLflow tracking, diagnostics JSON per commodity, an extensive research
notebook and standalone methodology and limitations documents.